
Diversity makes us all stronger—as a society, and as an economy

The U.S. has changed a lot over my lifetime as an Asian American. It’s 1969/70, when the white(-only), non-Hispanic population was 83.5% of the U.S. population. I’m in second grade and my family has moved from a Chicago suburb to a Detroit suburb where I was the only non-white person in my entire elementary school; in the face of bullying, I told my classmates that I wasn’t a “foreigner” (or even a child of immigrants) but had come from Hawaii. Twenty years later, in 1989/90, white-only people make up 75.6% of the U.S. population. I stopped at a McDonald’s in Boalsburg, PA, on the way out of State College (I was a professor at Penn State at the time); a young white boy (around five years old) spots me a couple places behind him and his mom in line, walks back to me while pointing up at my face and says with a combination of amazement and delight, “Look, Mommy, an Asian woman!” (He did say “Asian” and not “Oriental” which was fascinating to me even at the time.) Fast forward another twenty years, in 2009/10, when the white-only share had fallen to 63.7% of the U.S. population. I’m a mom of four biracial kids (then ages 11 to 18) in the Fairfax County, VA public school system in the Washington DC suburbs; my kids seamlessly mix in with their classmates and are oblivious to being any different from all the other kids from a racial/ethnic standpoint.
Times have changed in terms of how much someone who looks like me is viewed as “different” and an “outsider” – even in places where just 20 or 40 years ago, prejudice and hostility against non-white people (even the “model minority” Asian folks) was very real. So, I wanted to explore, alongside Avison Young’s data scientists, led by Brian Harper, if places that have more diversity in available workforce ultimately have stronger and more resilient economies.
My first question: Are states where the population is growing the most also where racial/ethnic diversity is most pronounced?
The new 2020 Census data spotlights just how much the U.S. population has diversified. States that are growing the most (in population and hence the size of the potential labor force) are those that are the most racially diverse, growing mainly because of their increasingly non-white(-only) population.
While white-only, non-Hispanic people still comprise most of the U.S. population (57.8%), their absolute count has declined by over 5.1 million since 2010 (when their share was 63.7%). In contrast, the fastest growing races and ethnic groups from 2010 to 2020 are Asians (+38.6%) and Hispanics (+23.0%), adding 6.7 million and 11.6 million people, respectively. The Black/African American population grew by 4.9 million or 11.7%.
The nationwide increase in the diversity of the population understates trends at the state level, which in turn understate differences across counties within states. The Census Bureau created a “diversity index” (DI) to more richly characterize the demographic diversity across and within states, where the index value is the probability that any two individuals drawn randomly from the state or county “urn” would be from two different race/ethnicity categories. The map below (Figure 1) shows state-level DIs for 2020, and the DI for the U.S. is 61.1%, an increase from its 54.9% value in 2010. The DI increased for all states from 2010 to 2020, but generally grew fastest in states that also showed above average population growth (shown in Figure 2). The Census Bureau’s interactive DI map also lets the reader dive into any state to see county-level data, and the “diversity of diversity” within any state is striking. (Take a spin through the data yourselves.)
Figure 1. “Diversity Index” values by state based on 2020 Census
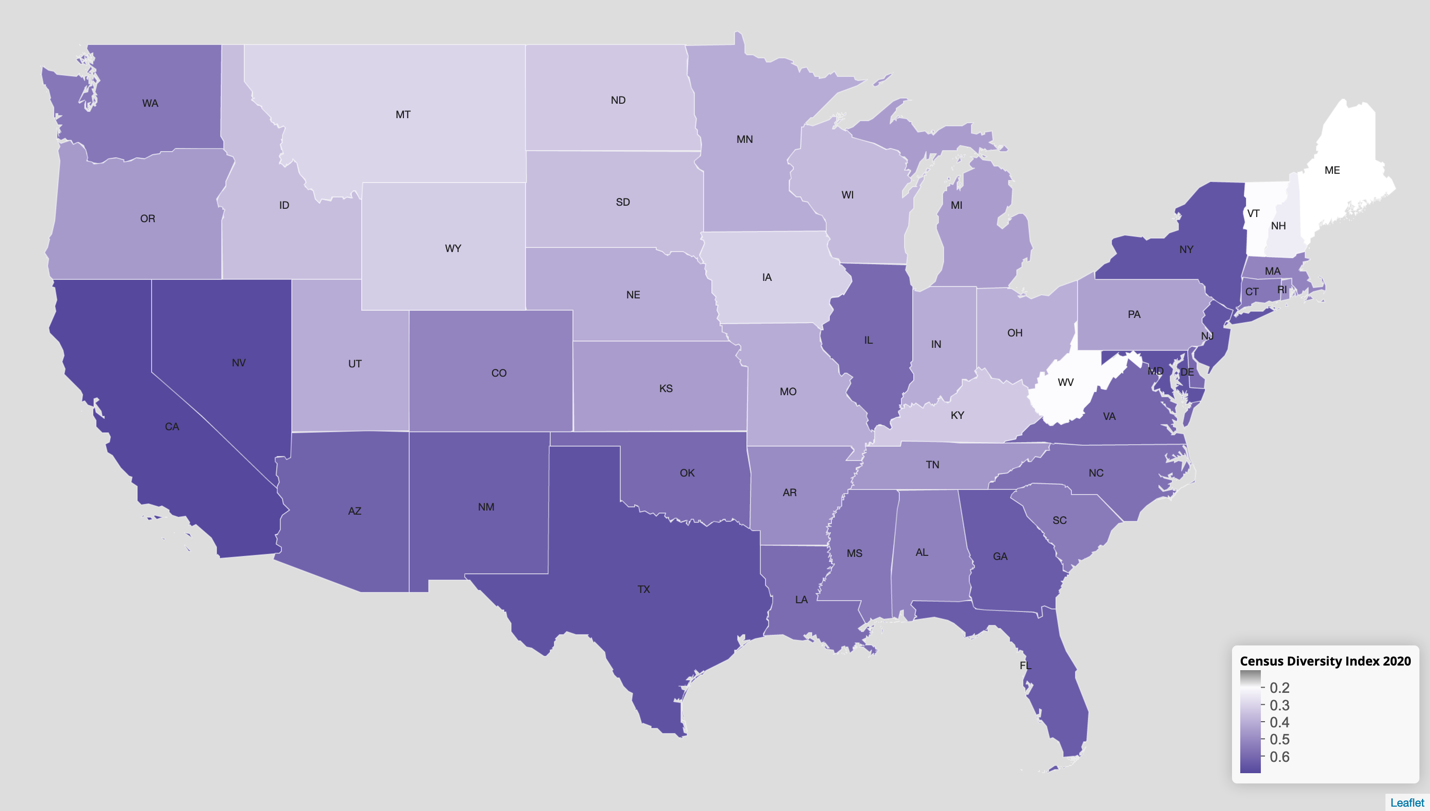
Source: U.S. Census Bureau
Figure 2. Population Growth 2010-2020
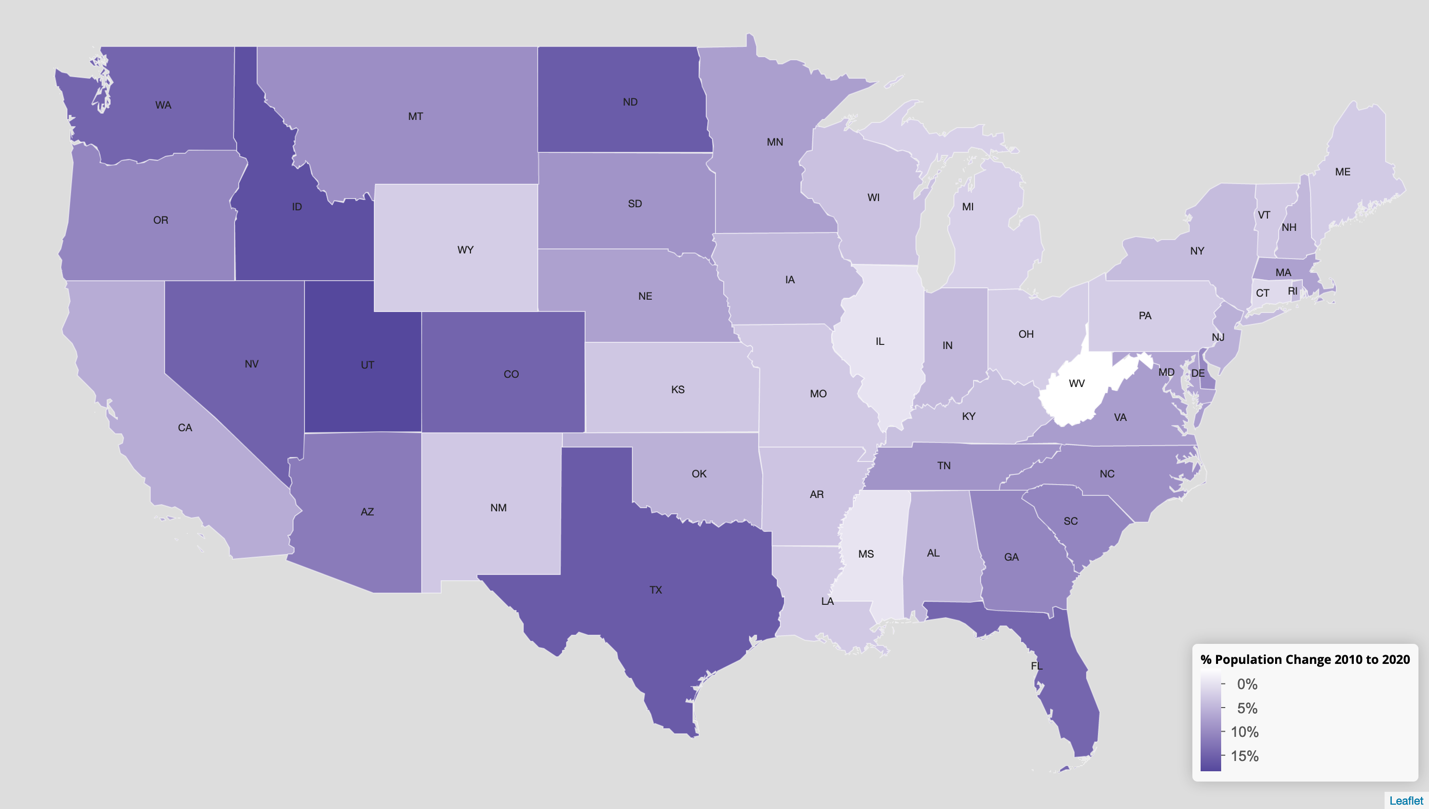
Source: U.S. Census Bureau
The table below shows the 10 states where population has grown the most (in absolute count) from 2010 to 2020:
Table 1. Top 10 States by Absolute Population Growth, 2010 to 2020
State |
change in population |
non-white share of pop growth |
Diversity Index in 2020 |
||
total |
white only |
implied non-white |
|||
Texas |
3,999,944 |
187,252 |
3,812,692 |
0.95 |
67.0 |
Florida |
2,736,877 |
215,781 |
2,521,096 |
0.92 |
64.1 |
California |
2,284,267 |
-1,241,666 |
3,525,933 |
1.54 |
69.7 |
Georgia |
1,024,255 |
-51,764 |
1,076,019 |
1.05 |
64.1 |
Washington |
980,741 |
42,016 |
938,725 |
0.96 |
55.9 |
North Carolina |
903,905 |
88,153 |
815,752 |
0.90 |
57.9 |
New York |
823,147 |
-705,340 |
1,528,487 |
1.86 |
65.8 |
Arizona |
759,485 |
120,900 |
638,585 |
0.84 |
61.5 |
Colorado |
744,518 |
239,870 |
504,648 |
0.68 |
52.3 |
Virginia |
630,369 |
-128,087 |
758,456 |
1.20 |
60.5 |
U.S. Overall |
22,703,743 |
-5,119,905 |
27,823,648 |
1.23 |
61.1 |
Source: U.S. Census Bureau (Census 2020 data) and author calculations
In this table, we use white-only, non-Hispanic population growth to calculate the implied non-white population growth. We find that population growth in these top 10 fastest-growing states from 2010 to 2020 (which totals 14.9 million, or two-thirds of overall U.S. population growth of 22.7 million) is driven mostly by the growth in the non-white(-only) population. In fact, several of these fastest-growing states – CA, GA, NY, and VA – experienced an absolute loss of white-only population, as did the U.S. as a whole. (While the U.S. grew by 22.7 million people from 2010 to 2020, the country’s white-only population decreased by 5.1 million.)
Why the absolute and relative loss of white(-only) people nationwide – the first time on record?
First and foremost, the white-only population is aging out as interracial partnerships and multiracial children become more common. There is now no single majority (>50.0%) racial category among the under-18 population even though white-only is still a majority share of the overall U.S. population. While the white-only population declined by 19.3 million (-8.6%) from 2010 to 2020, the white “in combination” population increased by 23.6 million (+315.8%!). The population of two or more races increased by 24.8 million (+275.7%!), and the “Asian in combination” (+55.5%) and “Black in combination” (+88.7%) categories grew at faster rates than the “Asian alone” (+35.5%) and “Black alone” (+5.6%) categories.
Second, the non-white immigrant population continues to increase, which is another reason why Asians and Hispanics are the fastest growing race categories. The Census Bureau projected in 2015 that the foreign-born population will grow by nearly 20 percent from 2010 to 2020, while the native-born population will only grow by only 6 percent. (Foreign-born data based on the 2020 Census have not yet been released.)
My second question: Do states with greater industrial diversification weather economic recessions better?
Think of this as being the labor market equivalent to what makes for a good, well-diversified portfolio of capital investments. The “Great Recession” of 2007-09 was brutal on states that relied heavily on manufacturing and construction jobs (see my July column on these goods-producing jobs being mostly “men’s work”). But the “Pandemic Recession” of 2020 (and the recovery we’re still in) has been worse for states that rely heavily on the service-providing, human-contact-intensive industries such as leisure/hospitality (restaurants and bars, music and sports venues) and brick-and-mortar retail sales – which is also why labor force participation has declined more for women than for men during the pandemic.
We explore this question by constructing an Industry Diversity Index. Inspired by the Census Bureau’s demographic Diversity Index, it uses state-level industry employment data from the Bureau of Labor Statistics rather than household demographic measures from the Census. The index measures the probability that any two workers drawn from a state’s total jobs “urn” are employed in different industries. For ease of comparison, it’s normalized around a value of 100, with higher values indicating a more diverse economy. The map below is based on data from July 2021.
Figure 3. Industry Diversity Index by Avison Young
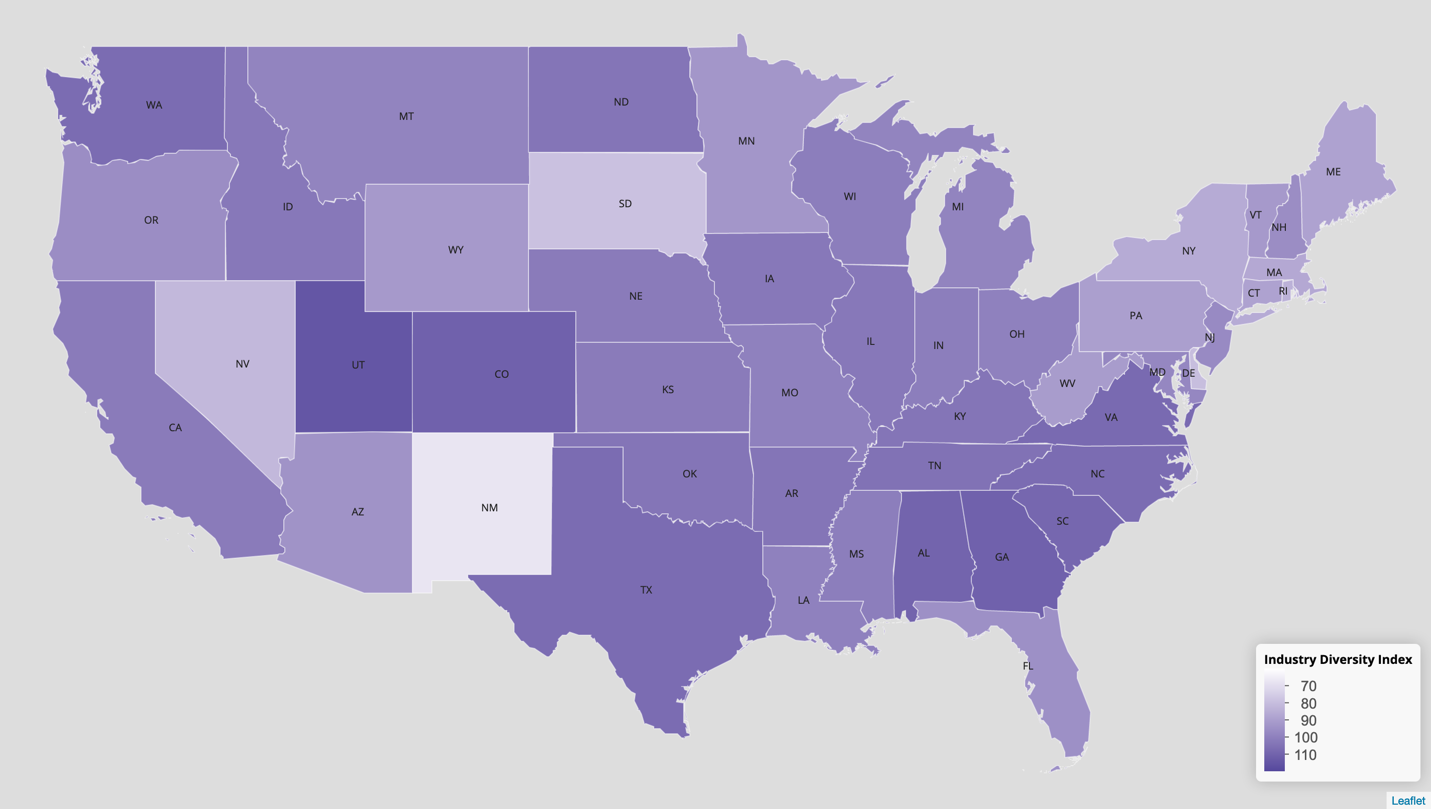
Source: Bureau of Labor Statistics data processed by Avison Young
To see the impact of industrial diversity on economic growth and resilience, we can compare the index to the seasonally adjusted unemployment rate. The plot below shows this relationship in February 2010, February 2020 (just before the pandemic), and most recently in July 2021 (as the economy is still recovering from the pandemic).
Figure 4. Industry Diversity Index vs. Seasonally-Adjusted Unemployment Rate
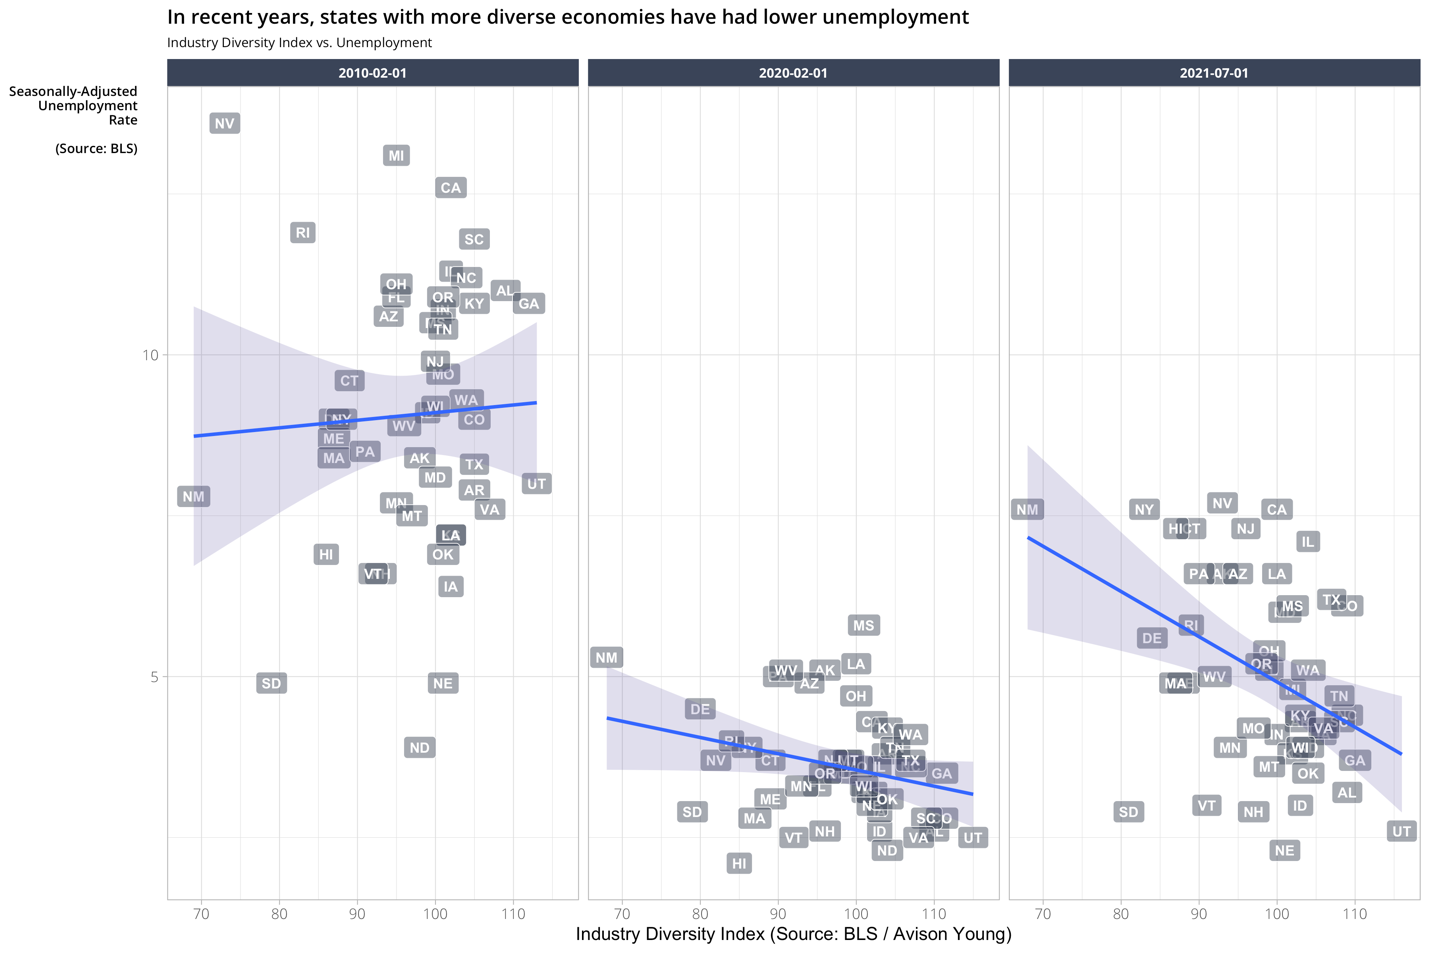
Source: Bureau of Labor Statistics data processed by Avison Young
In 2010, there's not much evidence of a relationship between unemployment rate and the Industry Diversity Index. This changes in 2020, though, and has become particularly pronounced in the current data, where more diverse states have been more resilient.
We can also look at growth in total employment. In comparing percentage growth/loss in employment between two time periods – February 2020 vs. 2010 and July 2021 vs. February 2020 – better performance is associated with more diverse economies.
Figure 5. Industry Diversity Index vs. Growth in Total Employment
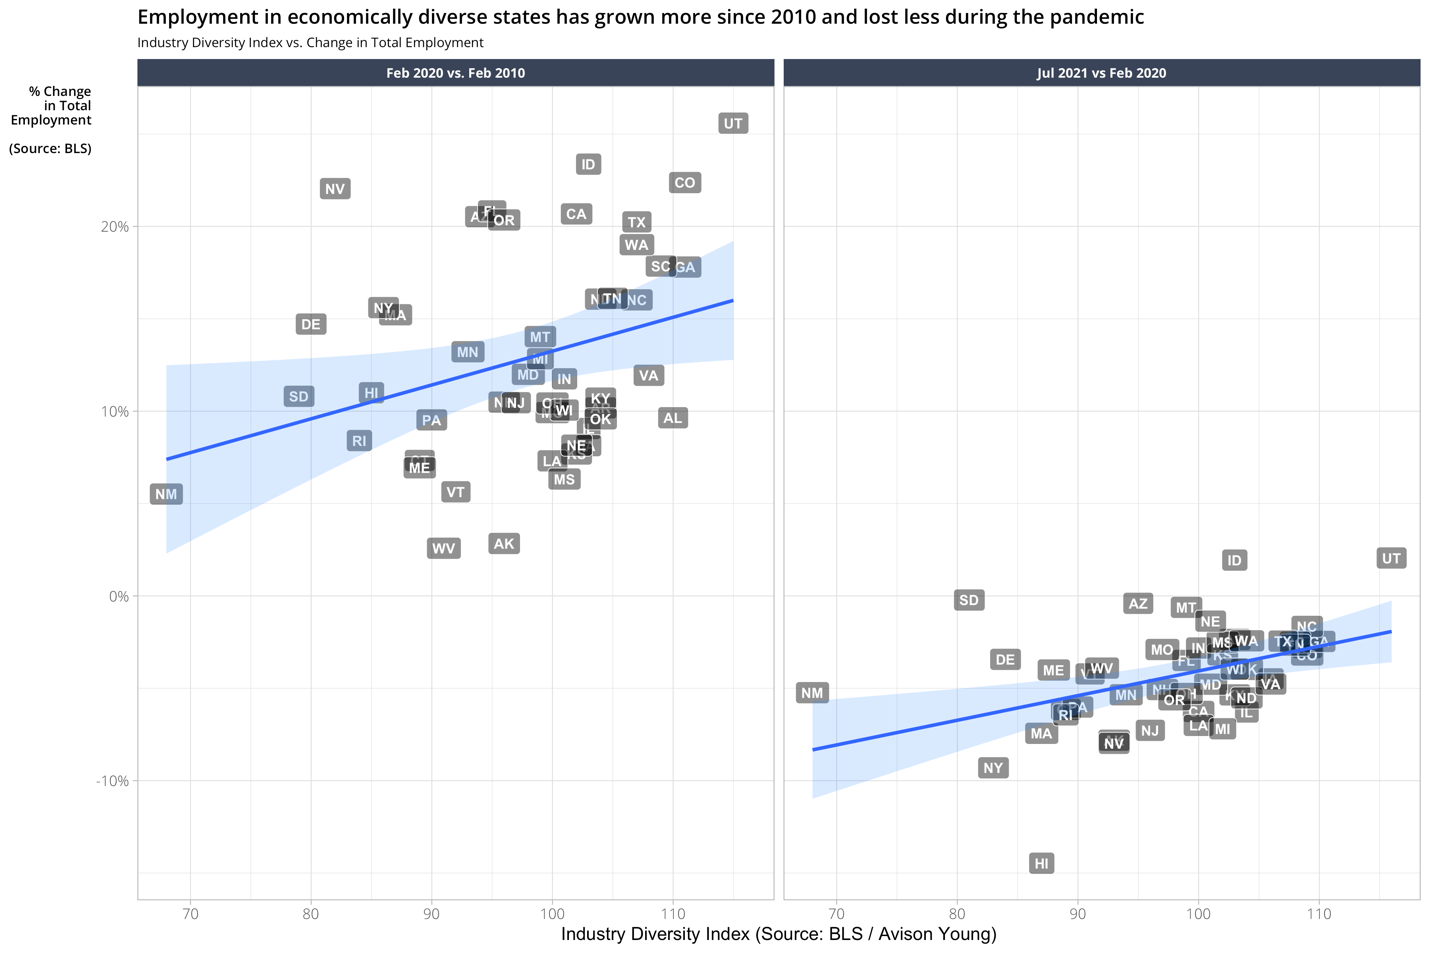
Source: Bureau of Labor Statistics data processed by Avison Young
During the pandemic, some sectors have been hit harder than others. Human service-providing industries such as education, healthcare, and leisure/hospitality have grown the most over the past decade while goods-producing sectors (namely manufacturing) have declined. But during the pandemic recession and ongoing economic recovery, these service sectors have been precisely the ones to suffer and struggle. In the ongoing pandemic recovery, in contrast to 10 years ago and pre-pandemic, there is a clear, positive relationship between percentage of non-manufacturing employment and the unemployment rate, as shown in the charts below.
Figure 6. Employment Outside of Manufacturing
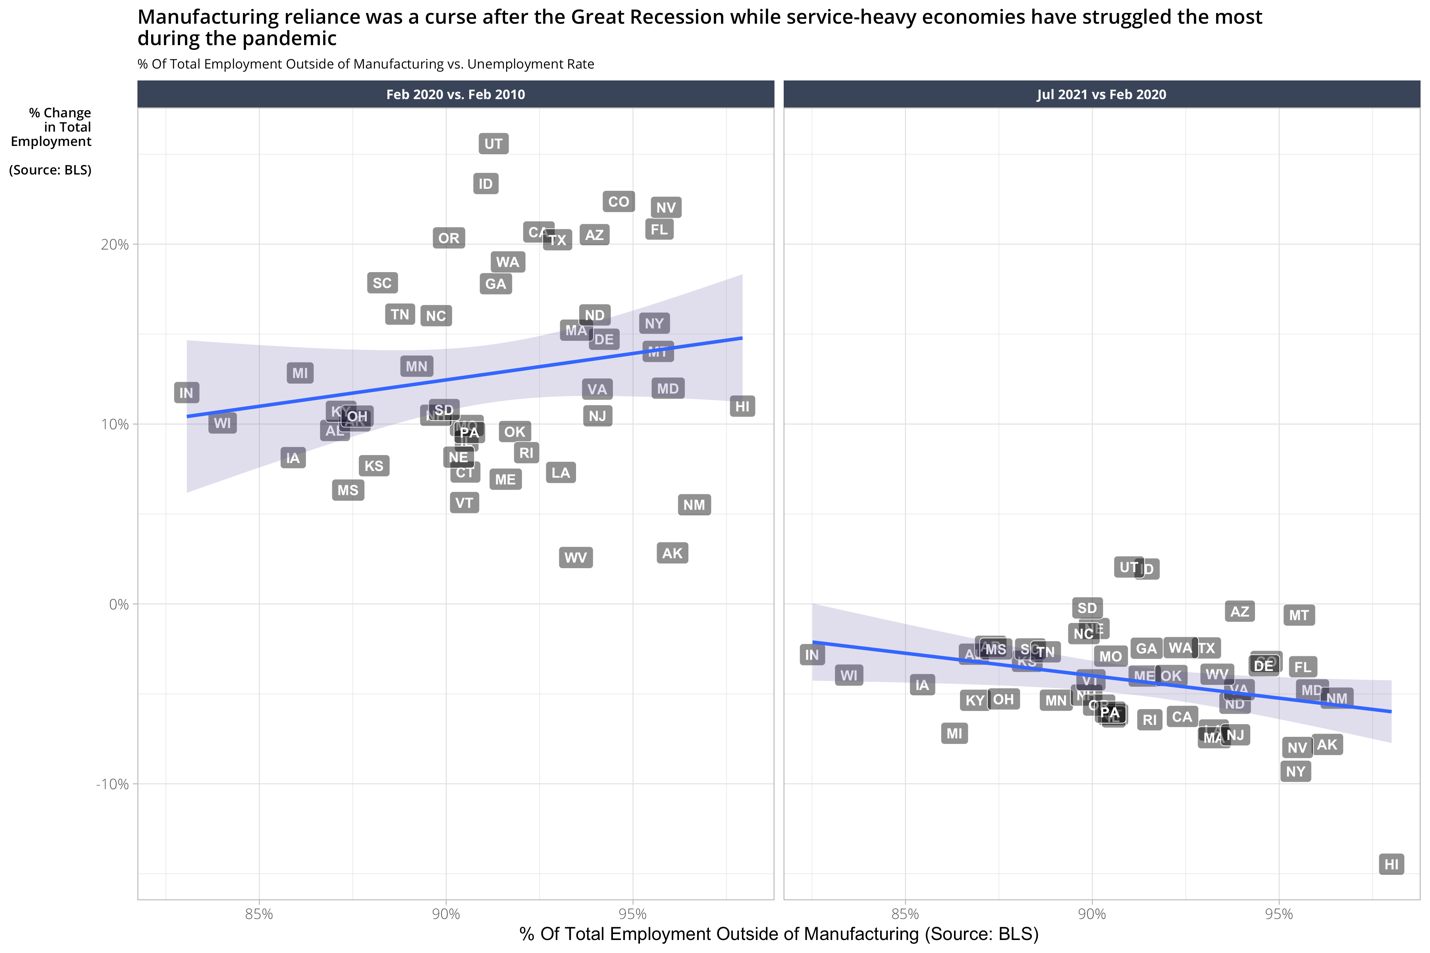
Source: Bureau of Labor Statistics data processed by Avison Young
So, diversity = economic resilience. How can states and local communities cultivate diversity and attract young workers?
Work has changed. So too has how, when and where it gets done. This means creating dynamic environments that support work as something you do (not where you do it) as a means of attracting, developing and retaining top talent. Every organization has a unique opportunity to embrace the multi-generational and multi-racial workplace – one where diversity of thinking and perspectives combine to foster collaboration and engagement, ultimately enhancing productivity. As this data demonstrates, diverse talent continues to grow – with the possibility of separating work location from life location – the resulting opportunities for innovation and economic successes, perhaps greater than they have ever been before.
To learn more about the pace at which this might happen, check out the rate of our return to downtowns in the Avison Young Vitality Index.
Diane Lim served as an Economist Mom in Residence at Avison Young during the summer of 2021. She has recently started as Policy Director for the Select Committee on Economic Disparity & Fairness in Growth for the U.S. House of Representatives. She worked closely with the firm’s insights team who drives AVANT by Avison Young, which leverages real-time data and analytics to make cities and location-based decisions more transparent and efficient. Her views are her own. Based in Washington, DC, Diane is a proud mom to four exceptional adults.
Brian Harper is Avison Young’s Global Practice Lead of Data Science. He is based in the firm’s Chicago office.