
Will the infrastructure bill fail to create jobs where we most need them?

Two months. That’s how long our most recent economic recession – what some call the “Pandemic Recession” – lasted, as officially called by the National Bureau of Economic Research (NBER). That February to April 2020 “peak to trough” is the shortest recession the NBER has ever recorded (going back to the mid-1800s), and also means we have been back in economic recovery mode for 15 months now!
Despite the recovery being in motion for so long, negotiations continue in a race to finish before the August Congressional recess over the bipartisan infrastructure framework, the latest version of the American Jobs Plan component of the Biden Administration’s “Build Back Better” agenda, which also includes the American Rescue Plan passed earlier this year (providing extended economic relief to households, businesses, state and local governments) and the American Families Plan (unveiled by the Administration but not yet part of bipartisan discussions).
These policies focus on an economic recovery strategy as the COVID-19 public health crisis has mostly been beaten back where vaccine rollout has been adopted. But does the latest policy effort focused on physical infrastructure (predominately roads and bridges) funding make sense given the economic condition it is intended to treat?
This time is different
Let’s first consider how different the pandemic recession has been from a typical economic recession, apart from being the shortest one ever: rather than being driven by some systemic underlying weakness in the economy which adversely affected the entire economy, it was a public health crisis which forced the near stoppage of certain parts of the economy (especially the human-intensive services parts). Thus, the usual economic policy prescription of stimulating the demand for goods and services by handing out money, and of creating jobs through government projects (like infrastructure spending), isn't necessarily the best approach for the recovery this time.
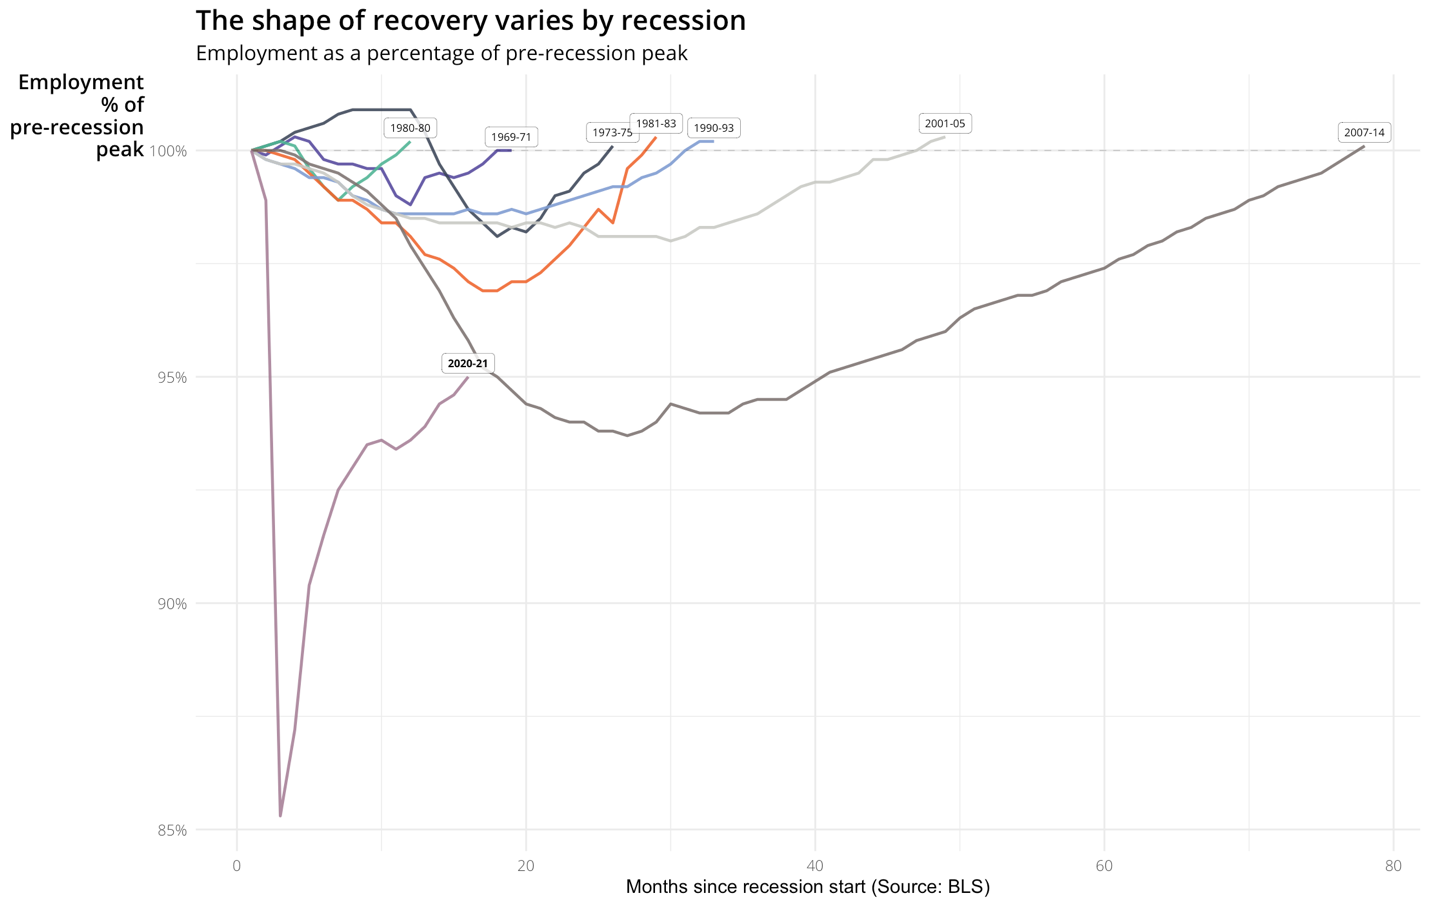
Inspired by a December 2020 Bureau of Labor Statistics report and extending and decomposing the establishment survey data, the AY data science team (thank you Brian, Aaron and David!) and I leveraged AVANT by Avison Young, which uses data and analytics to make cities and location-based decisions more transparent and efficient, to show job losses and subsequent recoveries in this latest recession compared with prior recessions. For employment overall, the short-duration, steep decline and subsequent quick (but not complete) bounce-back is unique from past recessions:
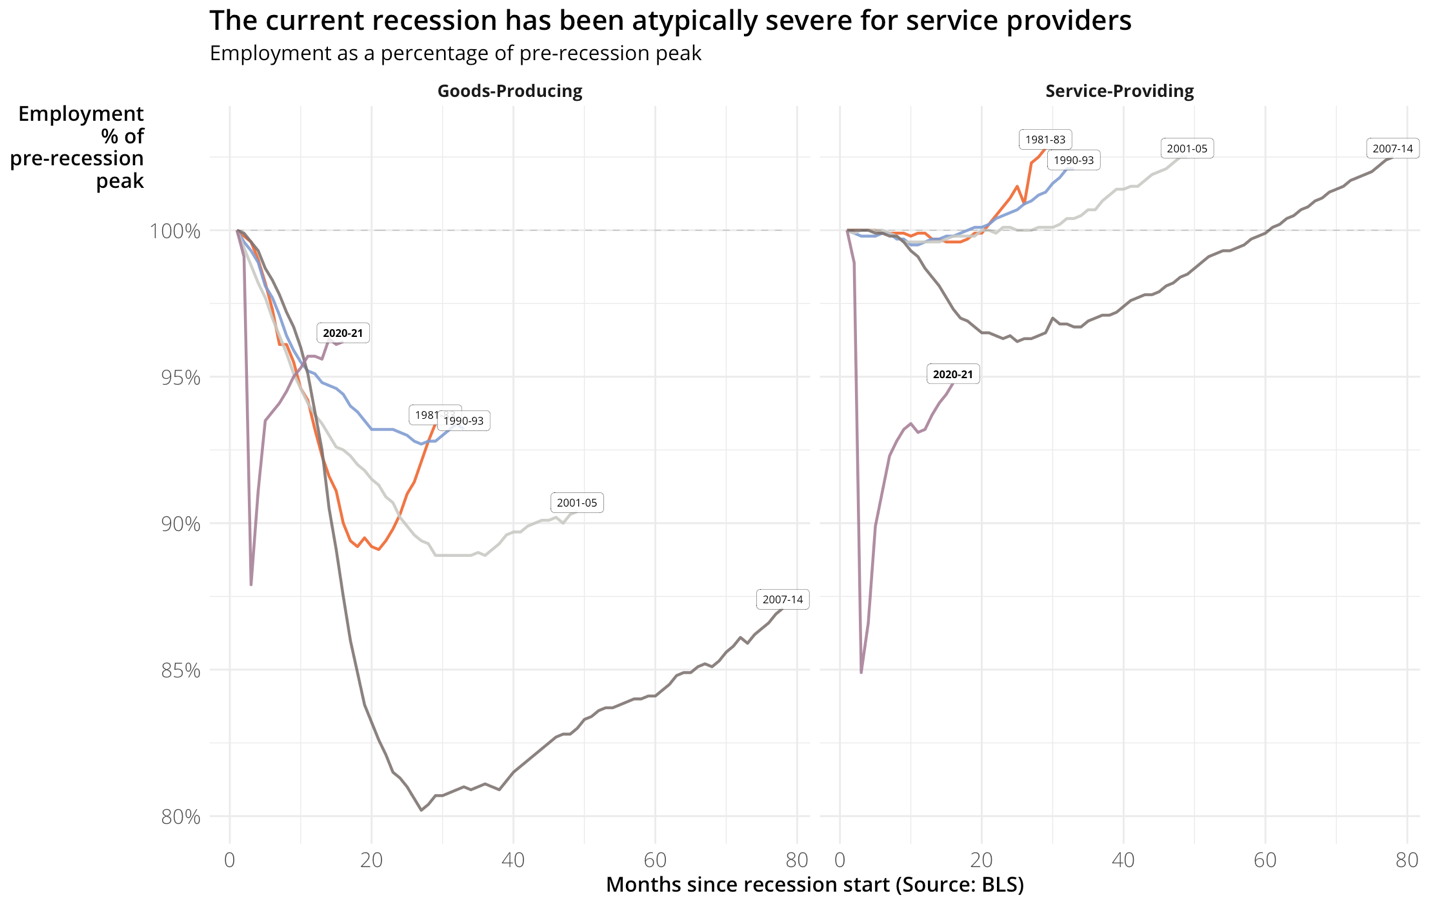
In addition to the uniqueness of the sudden and steep decline and rebound, the latest recession and current recovery is unique in how differently it has affected goods-producing jobs versus service-providing ones. During the Great Recession and its long-slog recovery (2007-14), manufacturing and construction workers (the goods-producing jobs) suffered the largest losses in employment. They never recovered to pre-recession levels, because that recession itself added a heavy acute/cyclical “insult” to the more chronic “injury” those sectors of the economy were experiencing even before the recession, as American consumers increasingly were choosing the consumption of “experiences” over the consumption of “things,” and as goods-producing jobs were the easiest kinds of jobs to automate or offshore. Meanwhile, service-providing employment was the most resilient during the Great Recession because demand for many of these services (think health, education, and caregiving – more “essential” services) did not go away with the economic downturn even as purchases of new homes and cars did.
The experience for goods-producing versus service-providing employment has been the opposite during the pandemic recession and recovery, because of the forced shut-down of consumer demand for (human-contact-intensive) services and because of the unusual circumstances holding back the (mostly female) supply of labor from these service industries, as many service-providing workers were forced to pull out or back from market work to devote their time to the care of their own family members (kids or elderly parents). The service-providing sectors of the economy have never experienced such severe losses in any prior economic recession.
The economic downturn in the pandemic recession has been much steeper compared with past recessions, and the quick rebounding from the bottom is just as unusual. But the economic recovery (which the NBER says began in April 2020!) has happened even without the additional government spending on infrastructure and families currently in debate – by virtue of it becoming safe for vaccinated people to go out and mingle in the economy again (and thanks to prior legislation that kept people economically afloat until then).
Consumer demand is largely back, especially in the leisure and hospitality sector, which posted the largest gains in both retail sales and employment in the latest monthly reports. Are these next, very large installments of government spending necessary to get us back to full employment? Would such spending potentially “overheat” the parts of the economy that are already in high gear – potentially creating a level of inflation (in certain parts of the economy, if not overall) that could prompt the Fed to raise interest rates again, thus slowing other components of current economic growth? Or would such spending deliver support where the economy most needs it, by helping to free up the productive capacity of the parts of the economy that still face mainly (labor) supply-side constraints in getting back to “normal”?
The challenge in helping the recovery from the “She-cession”
The trouble with the administration leading with the physical infrastructure investments and not the family investments in caregiving and other “human infrastructure” is that it might not create the kinds of jobs in the industries and occupations where our economy is still operating below our full capacity. Why? Because physical infrastructure is mainly built by male construction workers, who have not been lacking work during most of the pandemic. (Just look at all the major road construction projects that have made lots of progress while people were staying off the roads by working from home!) The chart below looks at employment levels during the pandemic recession and recovery, with a “running start” going back to January 2019, through the most recent monthly data for June 2021, and sets February 2020 employment (the peak which defines the start of the recession) to 1 (100%). Construction employment has risen above its pre-pandemic levels for most of the recovery, while caregiving and leisure and hospitality jobs have remained far below their pre-pandemic levels:
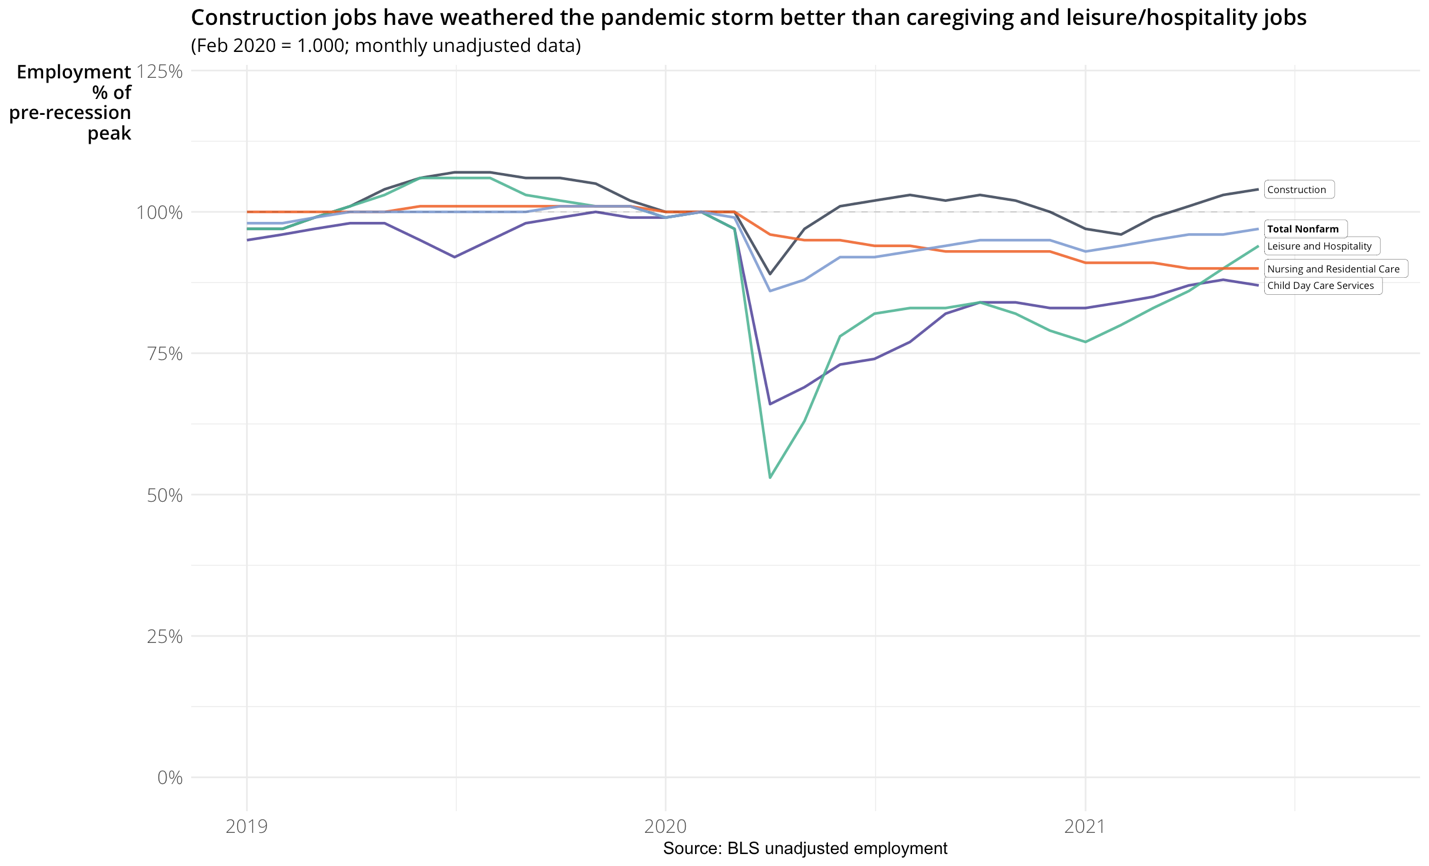
Given that construction jobs have already fully recovered to pre-pandemic status, it is less likely that greater infrastructure spending will create new construction jobs rather than merely changing the mix of projects that workers who are already employed will be working on and likely raising wages for an occupation already in short supply.
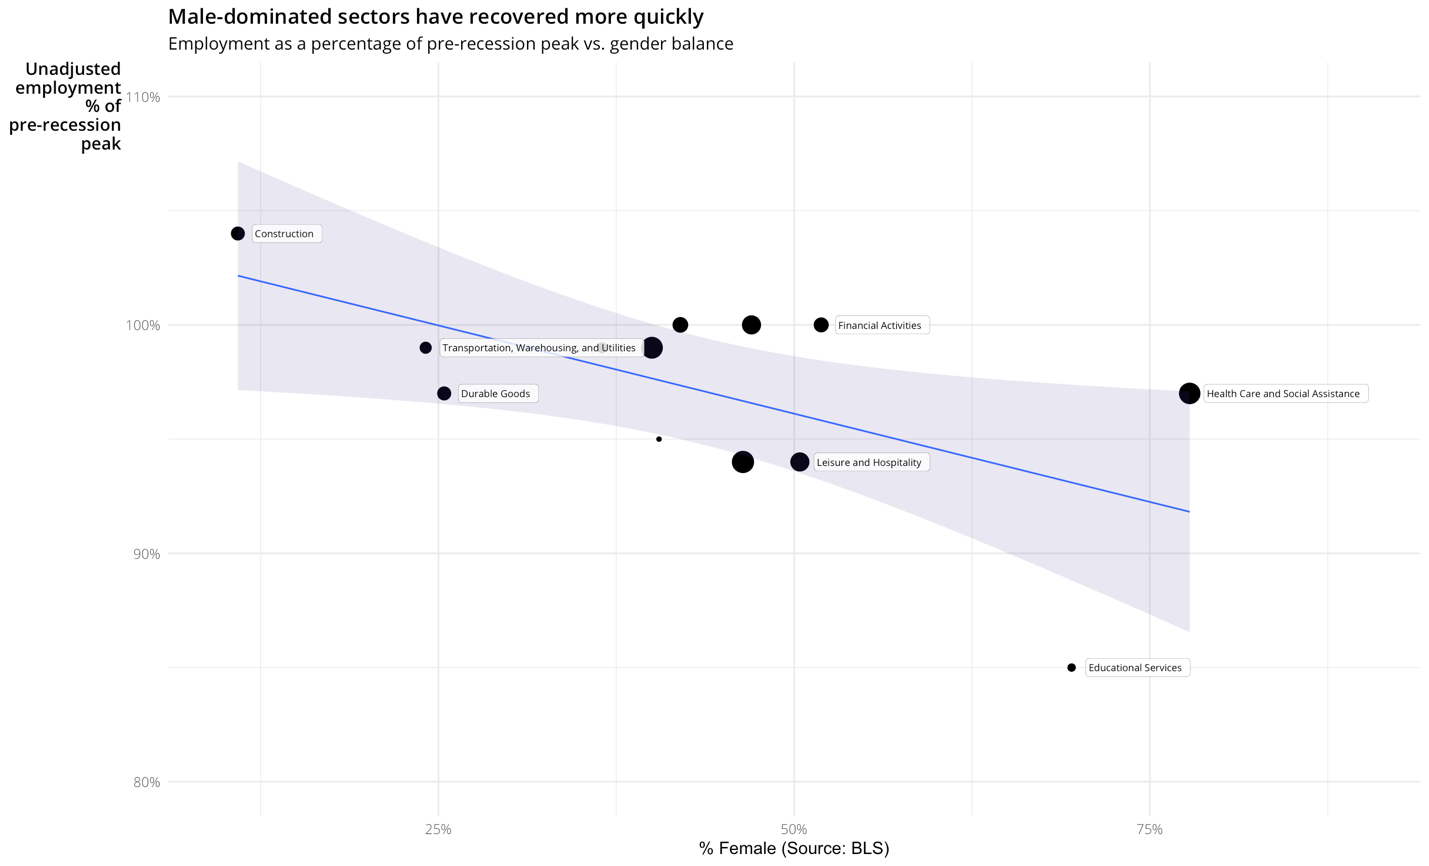
Greater spending on physical infrastructure would do little to help the recovery from the “She-cession”—the more severe job losses experienced by women because of the human-intensive service industries they tend to work in and the demands for their time at home caring for their family members. The long-standing gender and racial disparities in the labor market are not going to lessen by creating more demand for workers in the construction industry. (According to the Bureau of Labor Statistics, women account for only 10.9% of people working in construction.) By putting aside (at least for now) the human infrastructure part of the agenda, the Administration has prioritized male jobs over female ones.
Constraints on getting women back to pre-pandemic labor force participation are not going to go away by merely building more roads and bridges – or even the kinds of structures that might ultimately be the workplaces of female employees or the daycare centers for their children. Any other types of jobs that we think might be only eventually created by infrastructure projects seem to rely on the weak premise that “if we build it, the people will come.”
What is keeping our economy back from full employment is a mismatch of demand for workers with the available and willing supply of workers. (See my June piece on the geographic mismatch of leisure and hospitality workers, and the other factors limiting the supply or willingness of workers to go back to the same old hourly-wage, no-benefits jobs.)
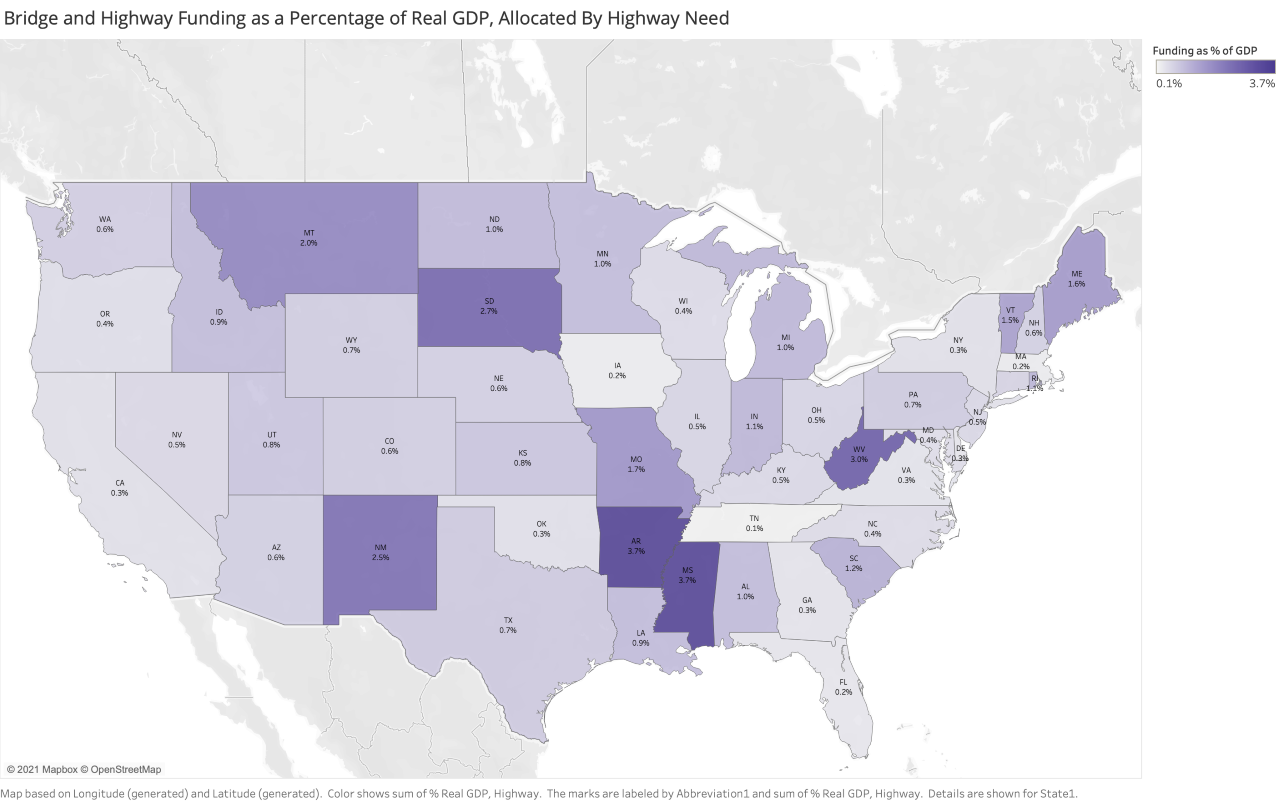
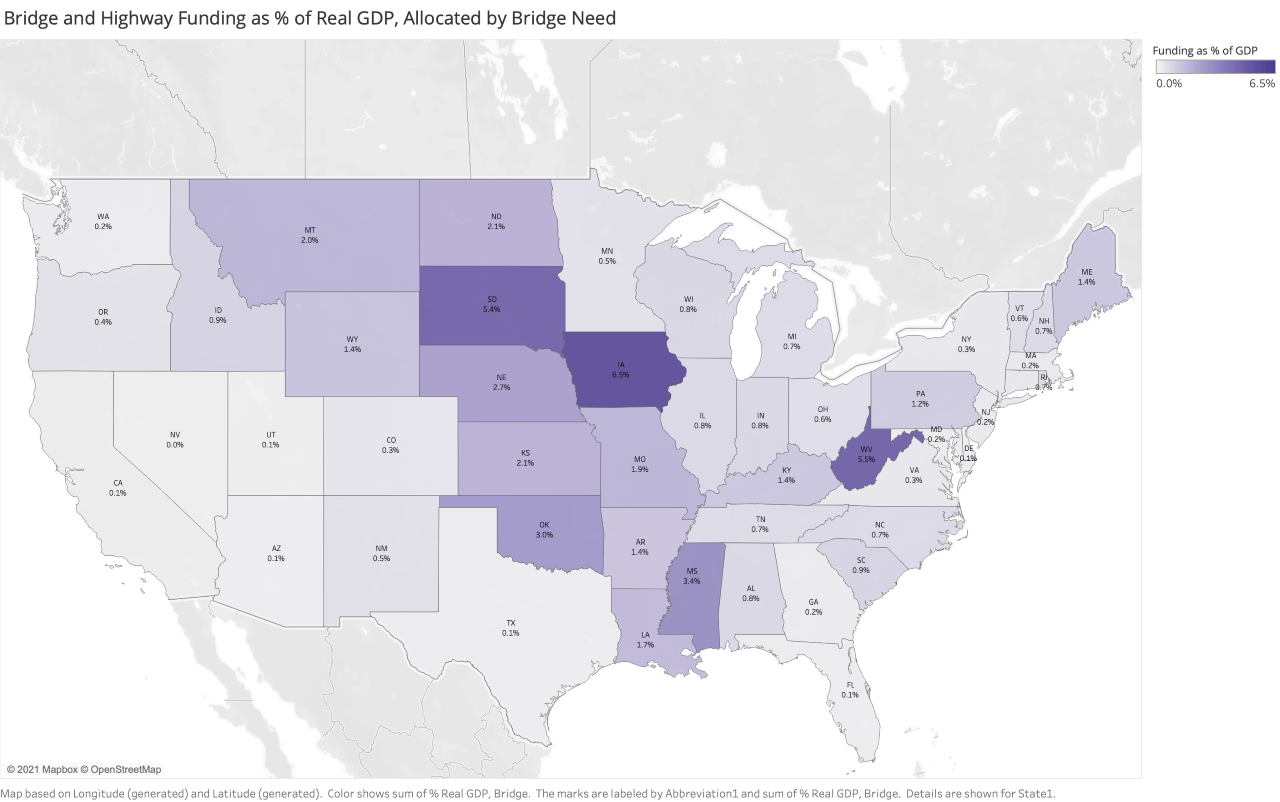
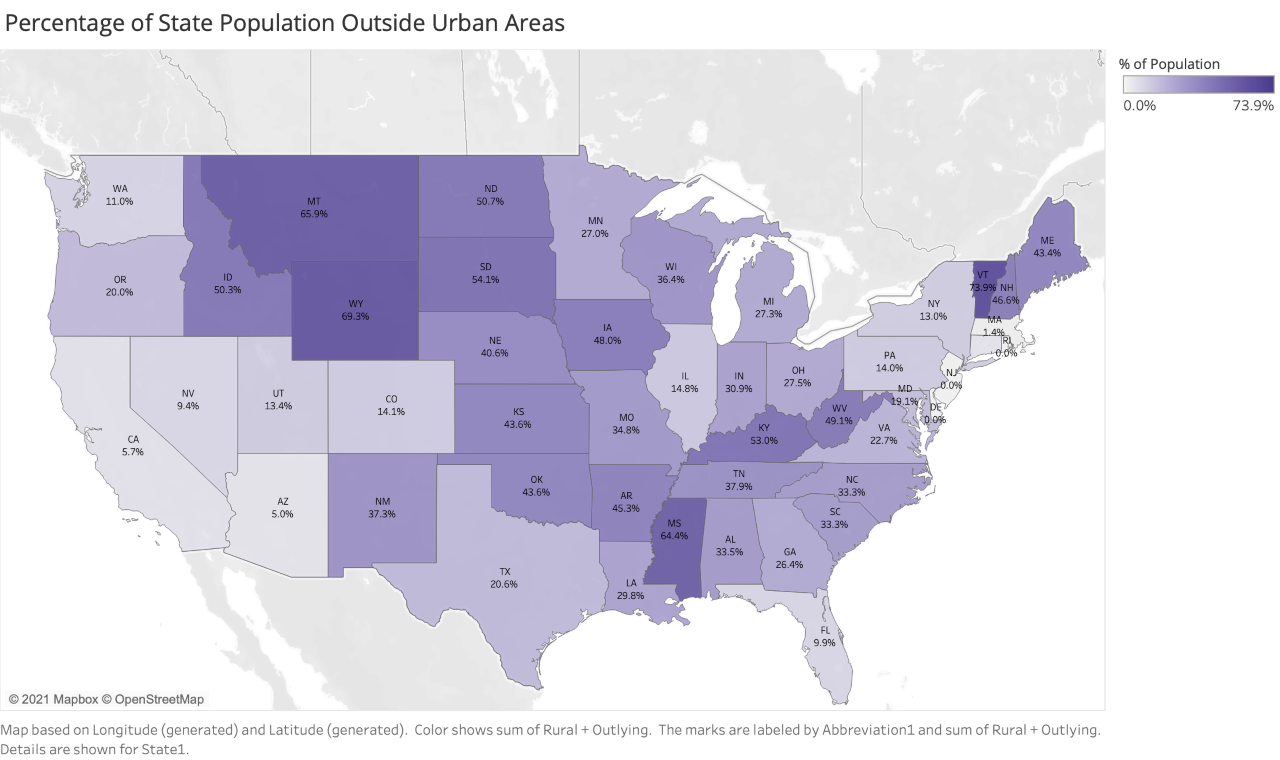
The geographic distribution of benefits from infrastructure spending are also diverse. Based on the state-by-state fact sheets the Administration released – consistent with data from the Federal Highway Administration bridge condition tables as well as the American Society of Civil Engineers’ state-by-state infrastructure overviews – the maps below show which states are likely to get the most funding relative to the size of their economies. In one scenario we allocate federal funding according to each state’s highway repair needs (in mileage), and in the other according to each state’s bridge repair needs (in number). The states that will likely enjoy the greatest boost to their economies from the infrastructure bill tend to be in the middle of the country in states with relatively low population density – as seen by the positive correlation between the infrastructure needs maps and the map showing the share of each state’s population residing in counties outside urban centers.[1]
So how did we get to the prioritization of male jobs over female ones? Probably because male work is more tangible and physical; female work is more invisible and sociological. (Much of what women do to support the market economy is not counted in GDP because it is provided “for free” at home.) Probably also because most politicians and economists are white males. While women and people of color represent 50.8% and 39.9% of the general population (according to 2020 Census data), their representation in Congress and among Ph.D. economists is only about half those shares.[2]
The geographic distribution of benefits from infrastructure spending are correlated not just with the rural/urban divide but with partisan politics as well. The irony is that policymakers who support the bipartisan physical infrastructure framework have put aside the human infrastructure components of the “Build Back Better” agenda as if the human parts are only “be kind” components and not the “be strategic” ones, when in fact (as I’ve written on my EconomistMom blog and on CNN Business) there cannot be any growth in our economic capacity without freeing up more of our potential labor supply by providing greater support to families for their caregiving needs.
I’m hoping the human infrastructure component of the Administration’s policy agenda will get its justified attention and (bipartisan) political support soon. We all have families, and every kind of economic activity has to start with people!
Diane Lim is serving as an Economist Mom in Residence at Avison Young. She works closely with the firm’s insights team who drives AVANT by Avison Young, which leverages real-time data and analytics to make cities and location-based decisions more transparent and efficient. Diane looks at the data underlying issues related to the U.S. economy, recovery and our communities. Her views are her own. Based in Washington, D.C., Diane is a proud mom to four exceptional adults.
Miss her last article? Read Diane’s perspective on the labor supply and demand challenges in the leisure and hospitality sector.
[1] The correlations between % of population outside urban areas and highway needs, bridge needs, and a 50-50 split of highway and bridge needs are, respectively, .509, .568, and .632.
[2] Women make up 27.2% of the current members of Congress, 23% of academic economists, and 30% of government economists. People of color are 23% of Congress, 21% of academic economists, and 24% of government economists. (Sources: Congressional Research Service, Pew Research Center, and the Brookings Institution.)