Is U.S. real estate investment healthier than many are suggesting?

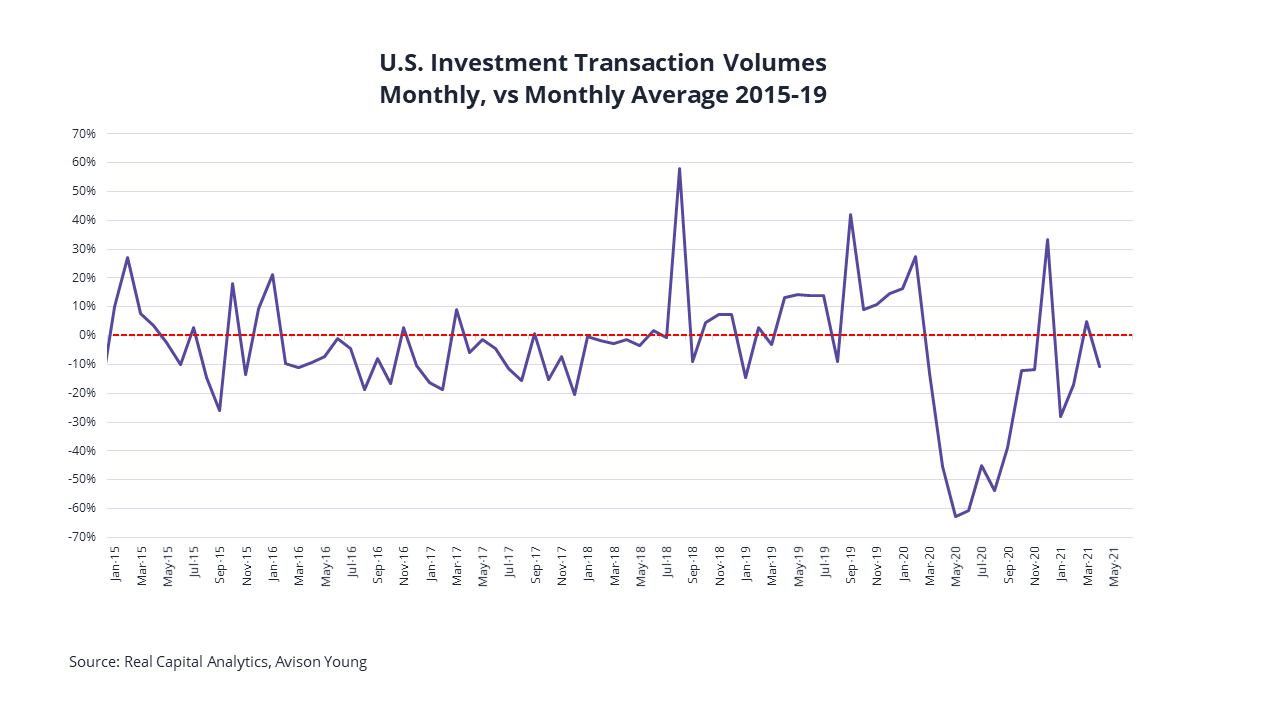
The latest data on U.S. investment transactions from Real Capital Analytics has been greeted with concern by some commentators. After a bounce toward the end of last year, activity fell sharply during the first quarter and was almost 30% below the level seen in the first 3 months of 2020. Transactions in the main commercial sectors fell by a third in April compared to March. But closer analysis, looking at activity within different sectors of the market and putting recent activity into a better historical perspective, offers greater cause for optimism.

Trends in investment activity require a longer-term comparison
When looking at the monthly transaction volumes over the last two decades, there are four clear periods in the runup to the COVID-19 pandemic, each of which shows a particular trend in investment activity:
- 2001-mid 2007: rising levels of transactions as the market recovers from the DotCom crash
- 2007-2009: declining activity during the Global Financial Crisis (GFC)
- 2010-2014: activity increasing again post-GFC
- 2015-2019: fluctuating volumes around an average that is high in historic terms

The market was very active in 2019, with volumes routinely at levels rarely seen since before the GFC. We can also see from the chart below that the market is highly seasonal, with fluctuations during the year as volumes typically build to a peak during the final quarter. Looking at the latest data and comparing it with the previous month or quarter – or even the equivalent period in 2019 – isn’t necessarily the best way to judge the “recovery.”

Monthly data is inherently volatile, so we have calculated three month rolling averages to reveal the underlying trend in activity. Rather than simply looking at the raw data, we have shown how activity compares to the average activity during the equivalent period over the five years prior to the pandemic – which we believe is a better benchmark for what is “normal.”
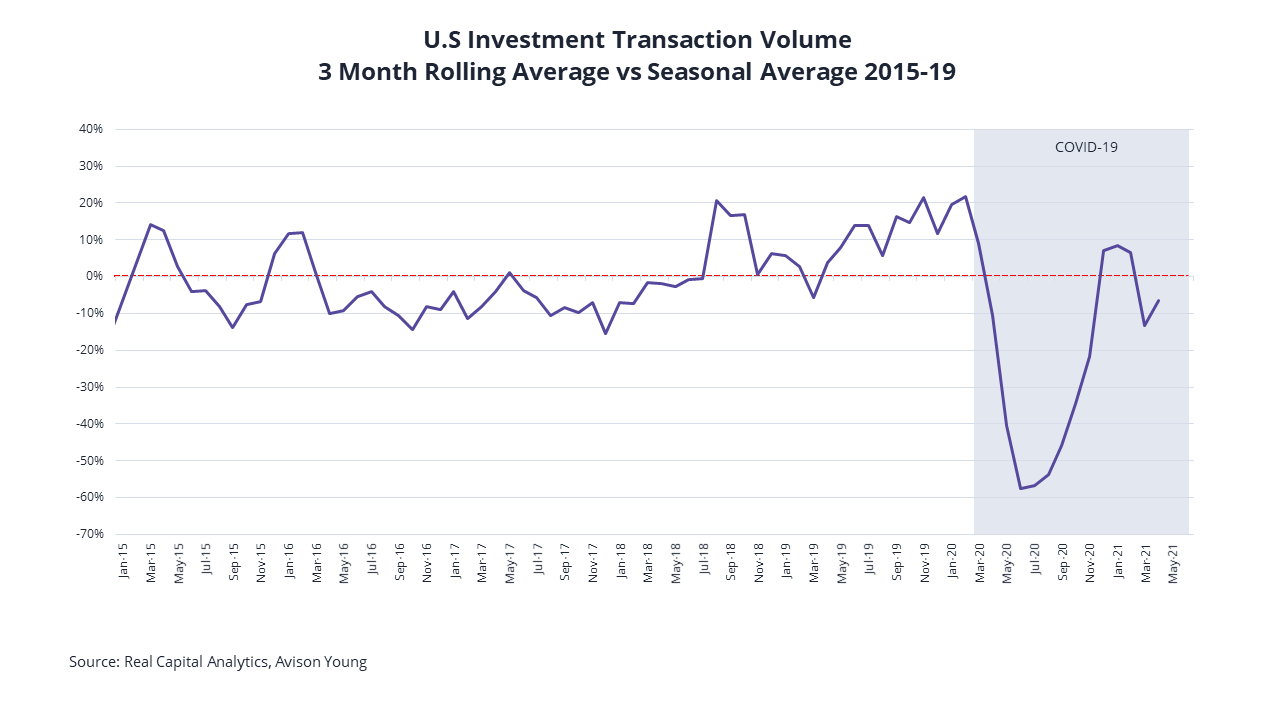
Compared to the average over this period, 2019 was a very active year in terms of total activity. Volumes fell to 60% below their 5-year average through the middle of 2020 but recovered strongly during the final quarter. In fact, with December registering the highest volume of deals on record, activity around the turn of the year was above average even allowing for the fact that this is typically the most active period for the market.
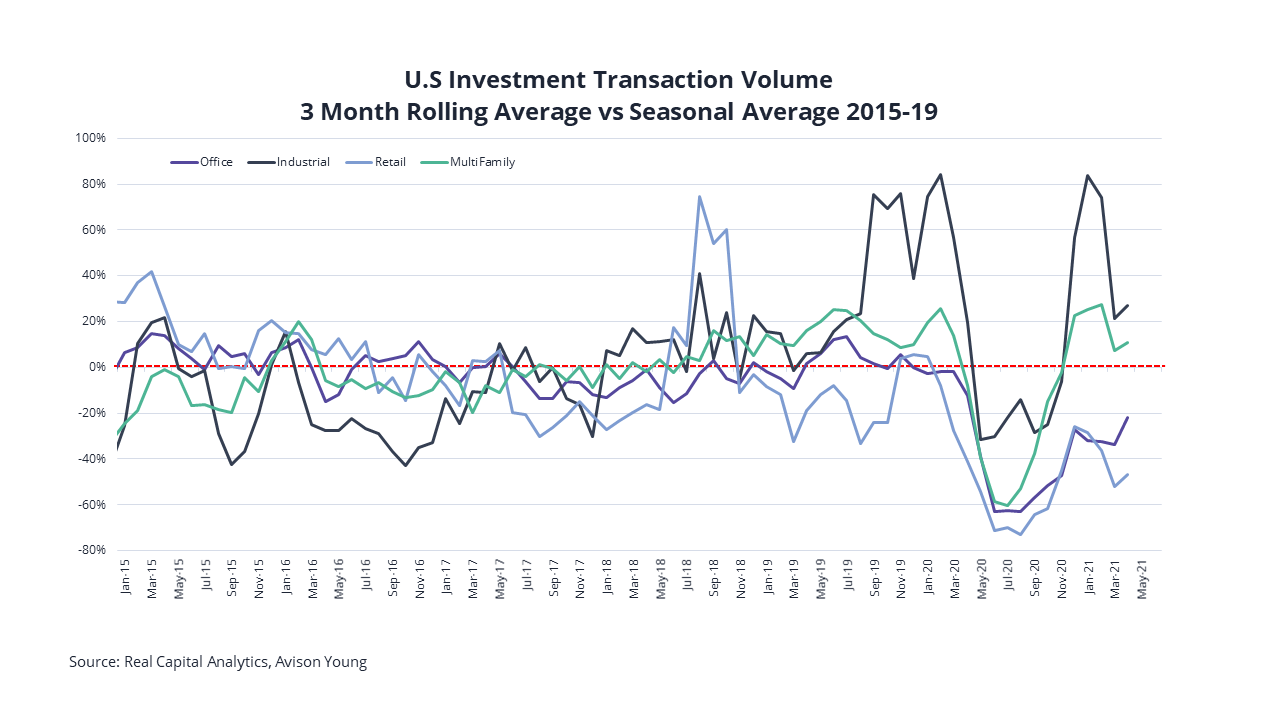
A distinct sector dimension offers a more nuanced look at investment activity
We can also see that there is a distinct sectoral dimension to market activity in the period leading up to, and during, the pandemic. Demand for industrial assets was particularly strong through the second half of 2019 and has suffered least during the pandemic. Activity recovered rapidly as investors bought into the strong fundamentals of a sector that has structurally benefitted from the recent crisis. The accelerated demand from e-commerce and global supply chain restructuring is likely to ensure that volumes in the sector remain elevated, albeit that pricing pressures and availability of quality assets are already a cause for concern in some markets.
Similarly, although not to the same degree, the “beds and sheds” theme saw multifamily residential investments trading at above average volumes for 18 months prior to the crisis. Although hard hit in the early stages, transactions bounced back sharply during the second half of 2020 and remained at above average levels throughout the first quarter of this year.
In contrast, retail volumes that were already below average in the couple of years prior to the pandemic were hardest hit by the crisis and only partially recovered through the end of the year. As in the other sectors, volumes have fallen back during the early part of this year as investors remain wary of a sector that continues to face severe structural headwinds. We believe that repositioning or repurposing of retail assets is now starting to attract attention. As pricing continues to adjust, the retail sector will likely offer some highly attractive opportunities in the years ahead, but it will take time for the structural changes to work through the system and this will inevitably impact investment activity for some time.
The office sector also saw a marked fall in transactions, which has taken on added significance as the potential structural implications of the crisis for the sector have become apparent We believe that the office has a crucial part to play in the future of work. Employees will want to work more flexibly in future, and this will impact the size and nature of occupier portfolios as well as the type of office space needed. This evolution is likely to play out more quickly than in the retail sector, but the implications for individual occupiers and the market remain unclear.
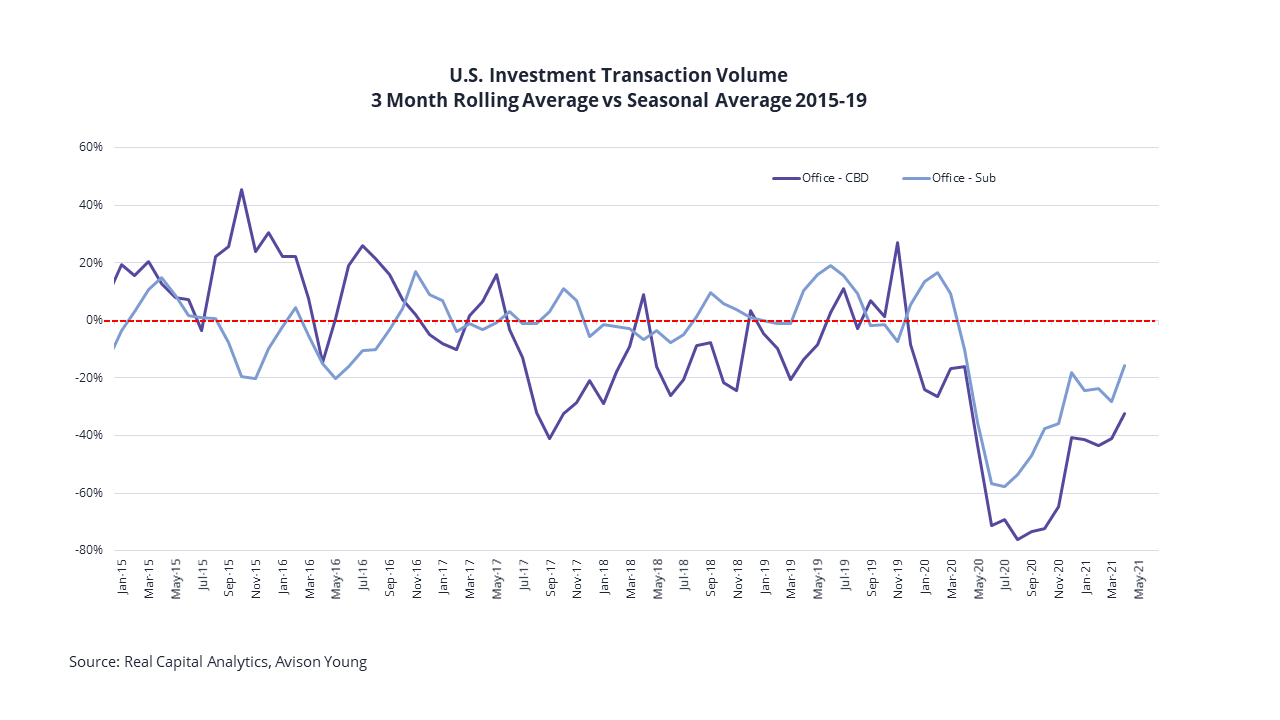
It is notable that investment transactions in CBD offices fell further, and have recovered less strongly, than volumes in the suburban office sector. Investors have recognized that decentralized offices could well be a long term beneficiary of the post-COVID world, with a residential shift to the suburbs, shorter commutes, distributed office portfolios and a reluctance to use congested public transport as likely future trends. At the margins this could all prove true, but we believe that heralding the death of the CBD is just as mistaken as proclaiming the demise of the office. For those who do wish to retain a downtown presence, prime buildings in premier locations will be in demand. Investment volumes are likely to remain somewhat depressed while the pandemic lingers and occupier uncertainty over the shape of return-to-the-workplace policies persist through the summer. Come the Fall, we expect activity to pick up with investors following employees in heading “back to the office.”
Real estate’s general strength and high returns continue make it an attractive investment
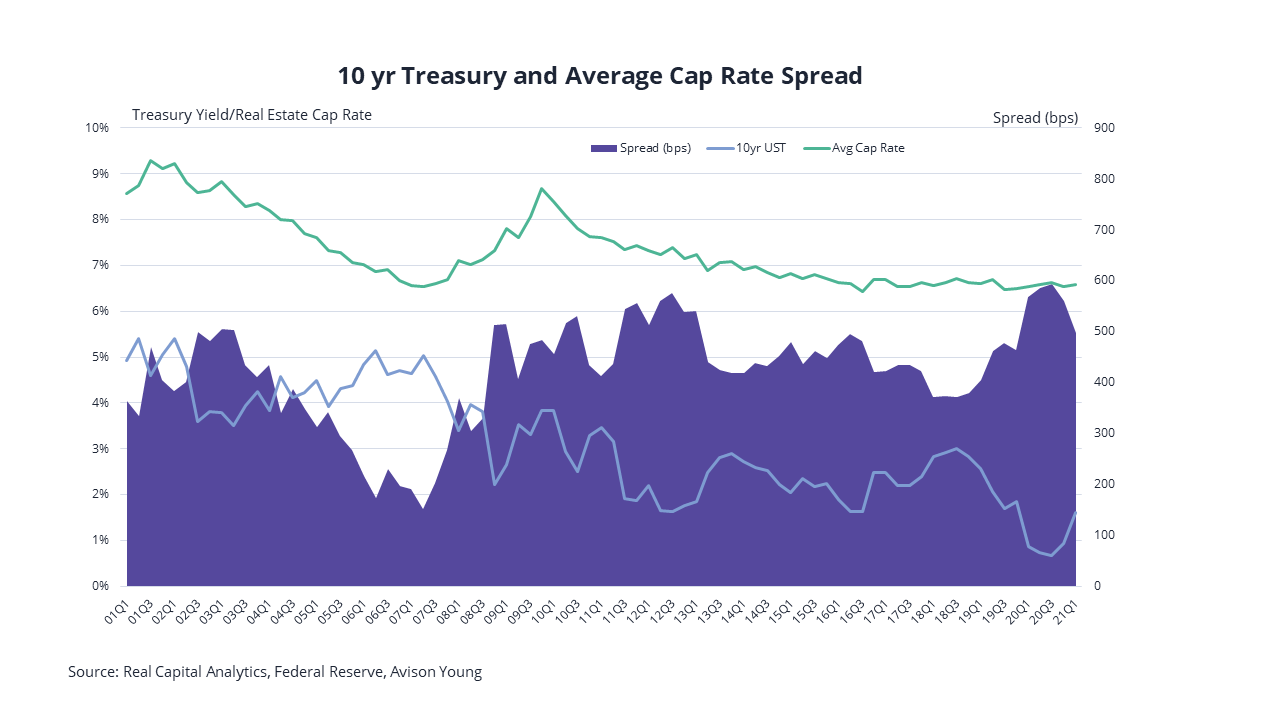
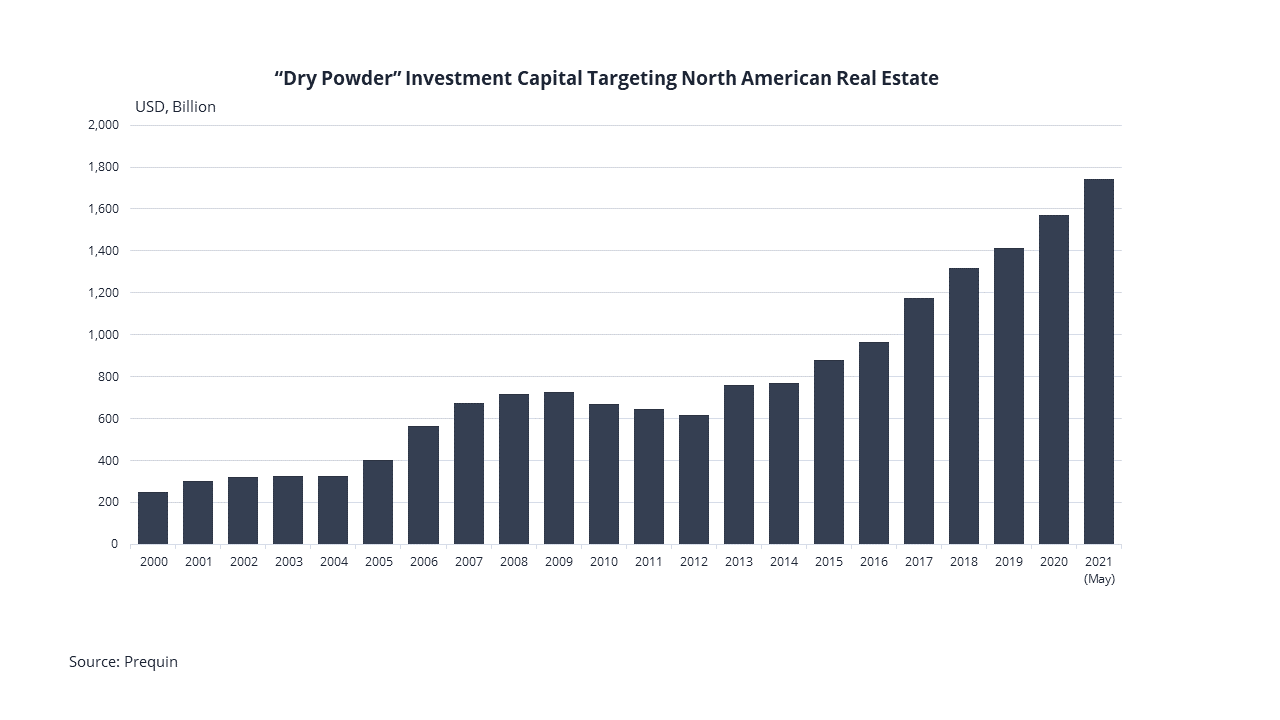
Uncertainty creates exceptionally challenging periods for investors. The prospect of higher inflation is putting upward pressure on Treasury yields, with implications across asset classes. Nevertheless, the defensive qualities of real estate coupled with its high income return mean the sector continues to look attractive given the historically high spread between cap rates and bond yields. Moreover, data from Prequin shows that the level of “dry powder” investment capital targeting North American real estate has risen to record levels. This contrasts with the downward trend seen from 2009-12 and suggests that recent weakness in volumes is due to pricing uncertainty and the practical difficulty in accessing stock, rather than the liquidity crisis which followed the GFC.
Finally, while individual monthly data may be misleading, it is worth noting that the total value of transactions recovered from its January low and was just above the 5 year average in March. Transactions in the office sector also bounced back to their pre-Covid average; although CBD volumes fell somewhat in April, suburban volumes have held up well. Could investors be set to “return to office” sooner than we think?