
-
 Office busyness in MSP: is this new normal here to stay?
 -
 New product deliveries continue to place upward pressure on space availability throughout the Philadelphia industrial market
 -
 Class B office activity rebounding in New Jersey
 -
 Law firms drive DTLA sublease drop - Down 24% from peak, yet still 269% above pre-pandemic
 -
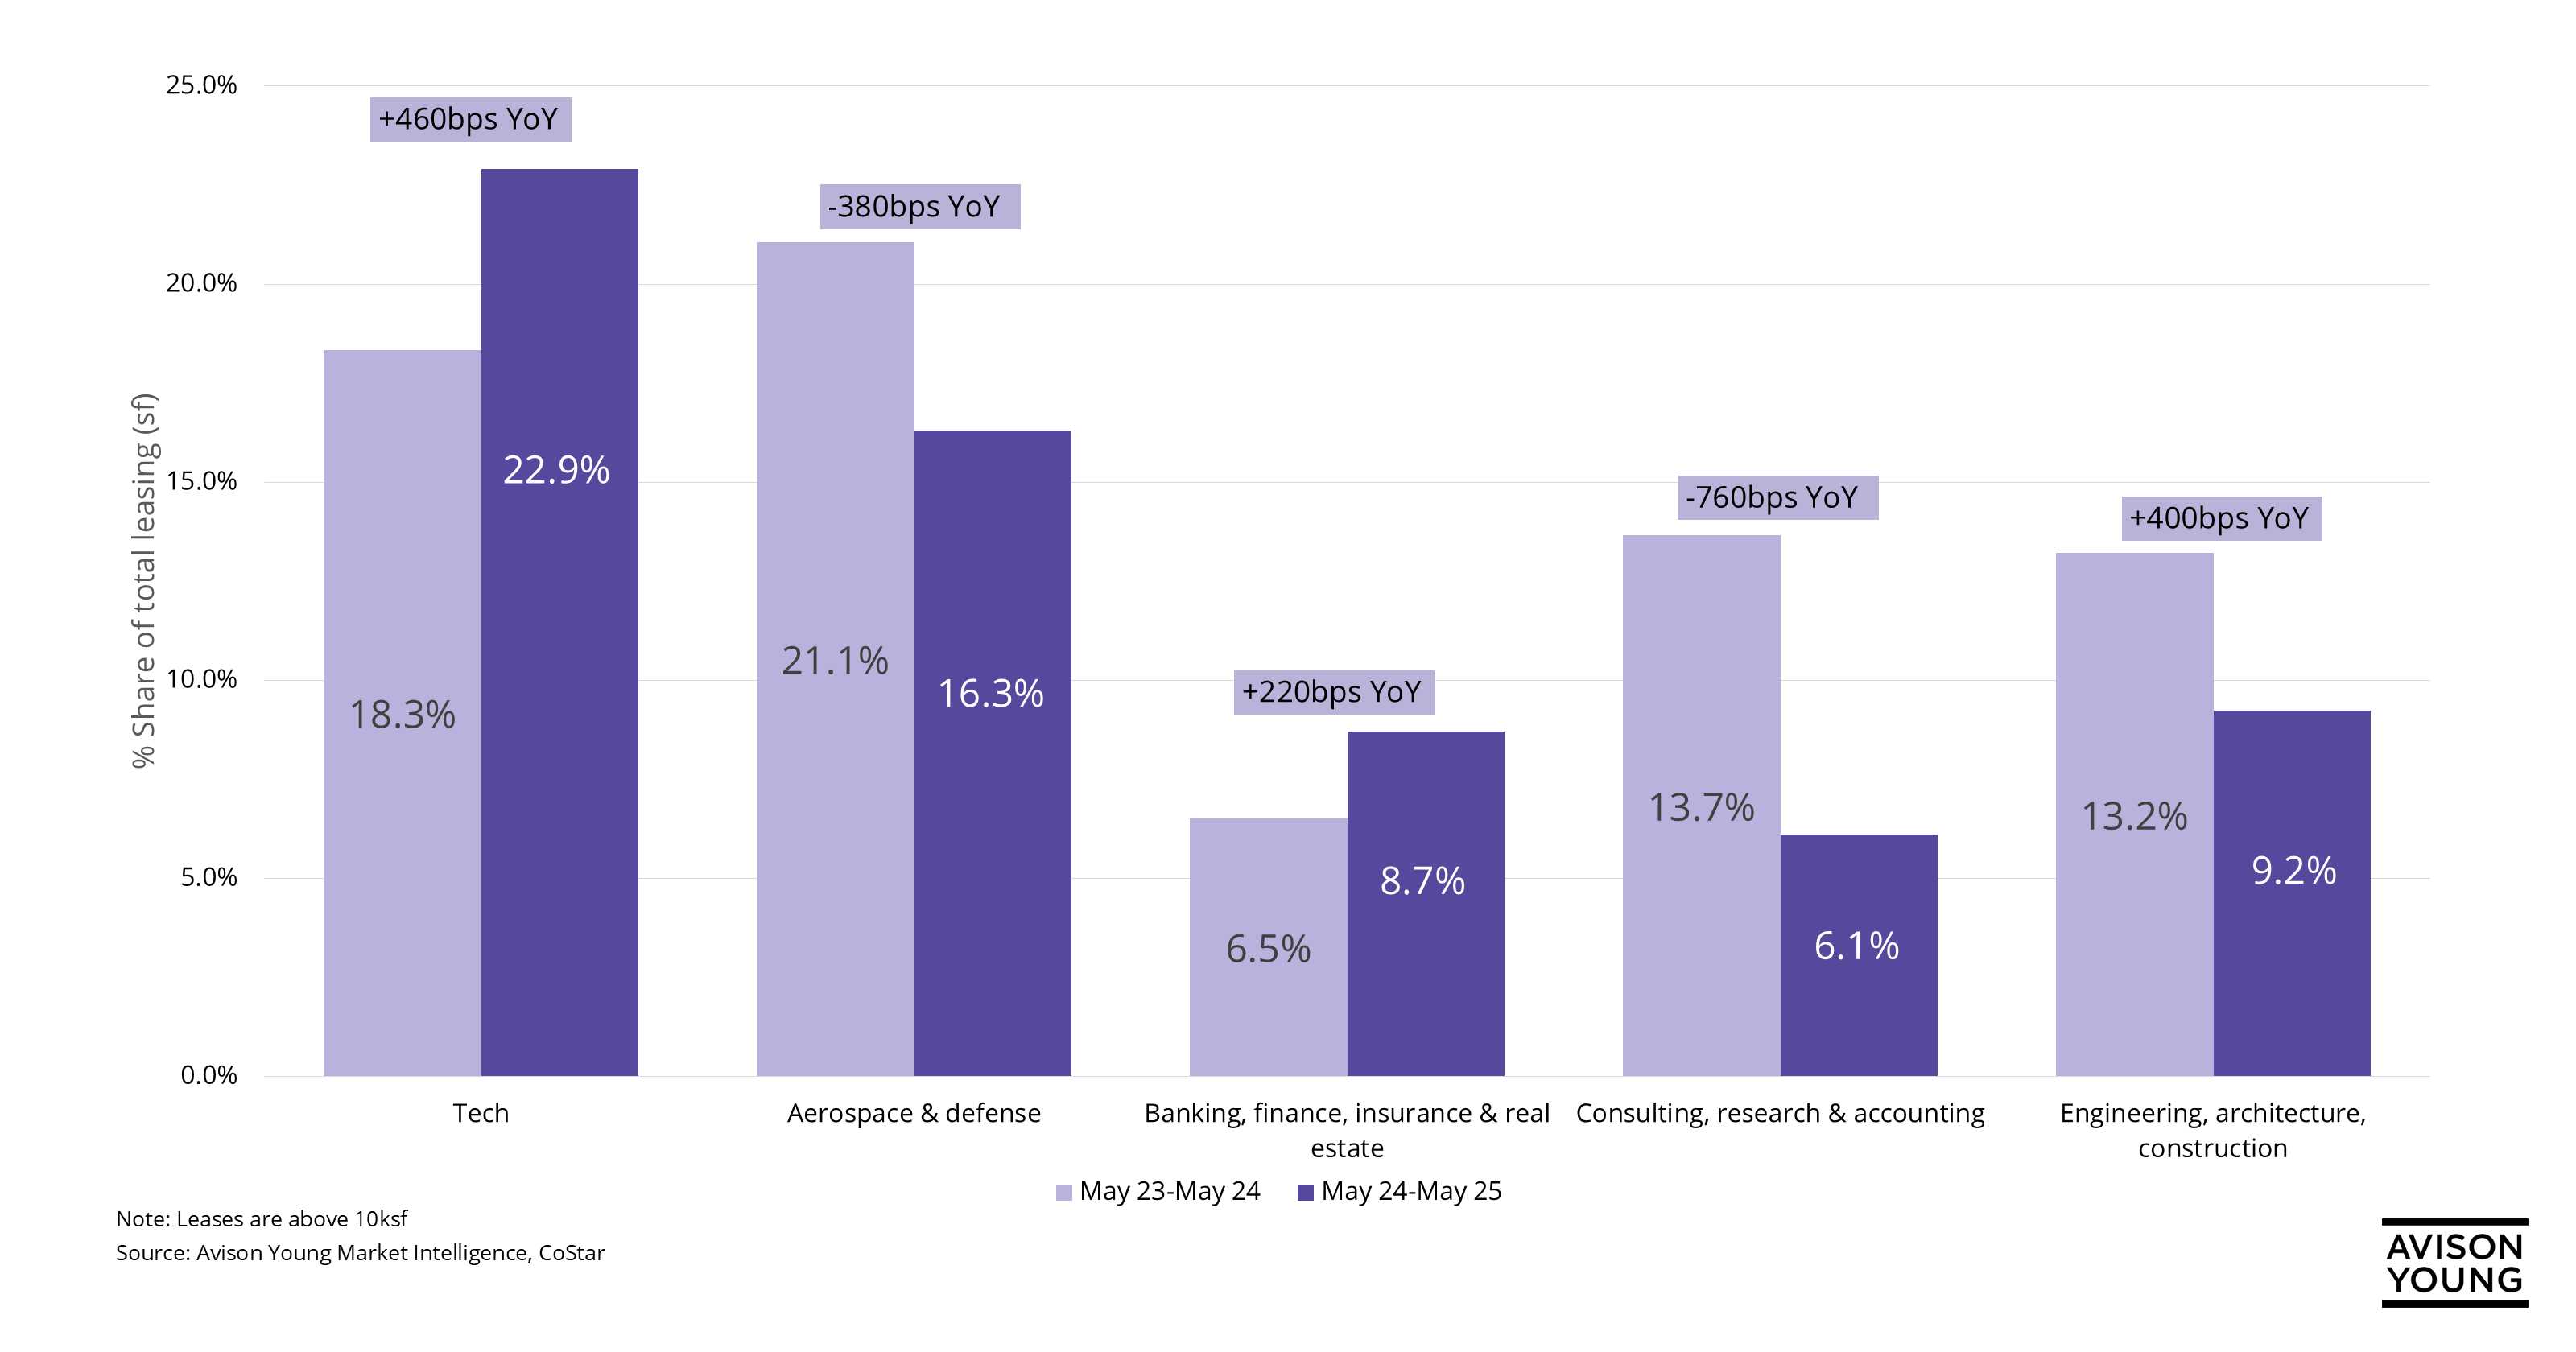 Tech and defense industries lead office leasing activity in Northern Virginia
 -
 Phoenix’s empty offices are quietly turning into apartments
 -
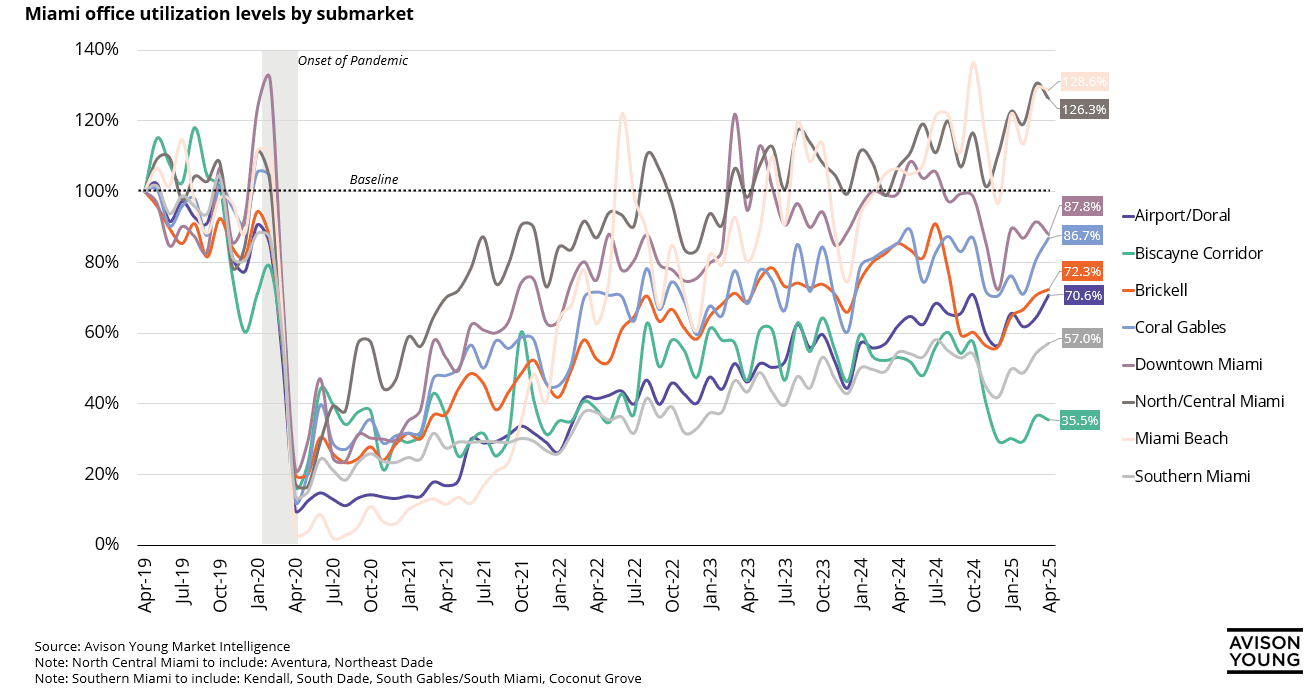 Miami Beach offices seeing strongest return-to-office activity
 -
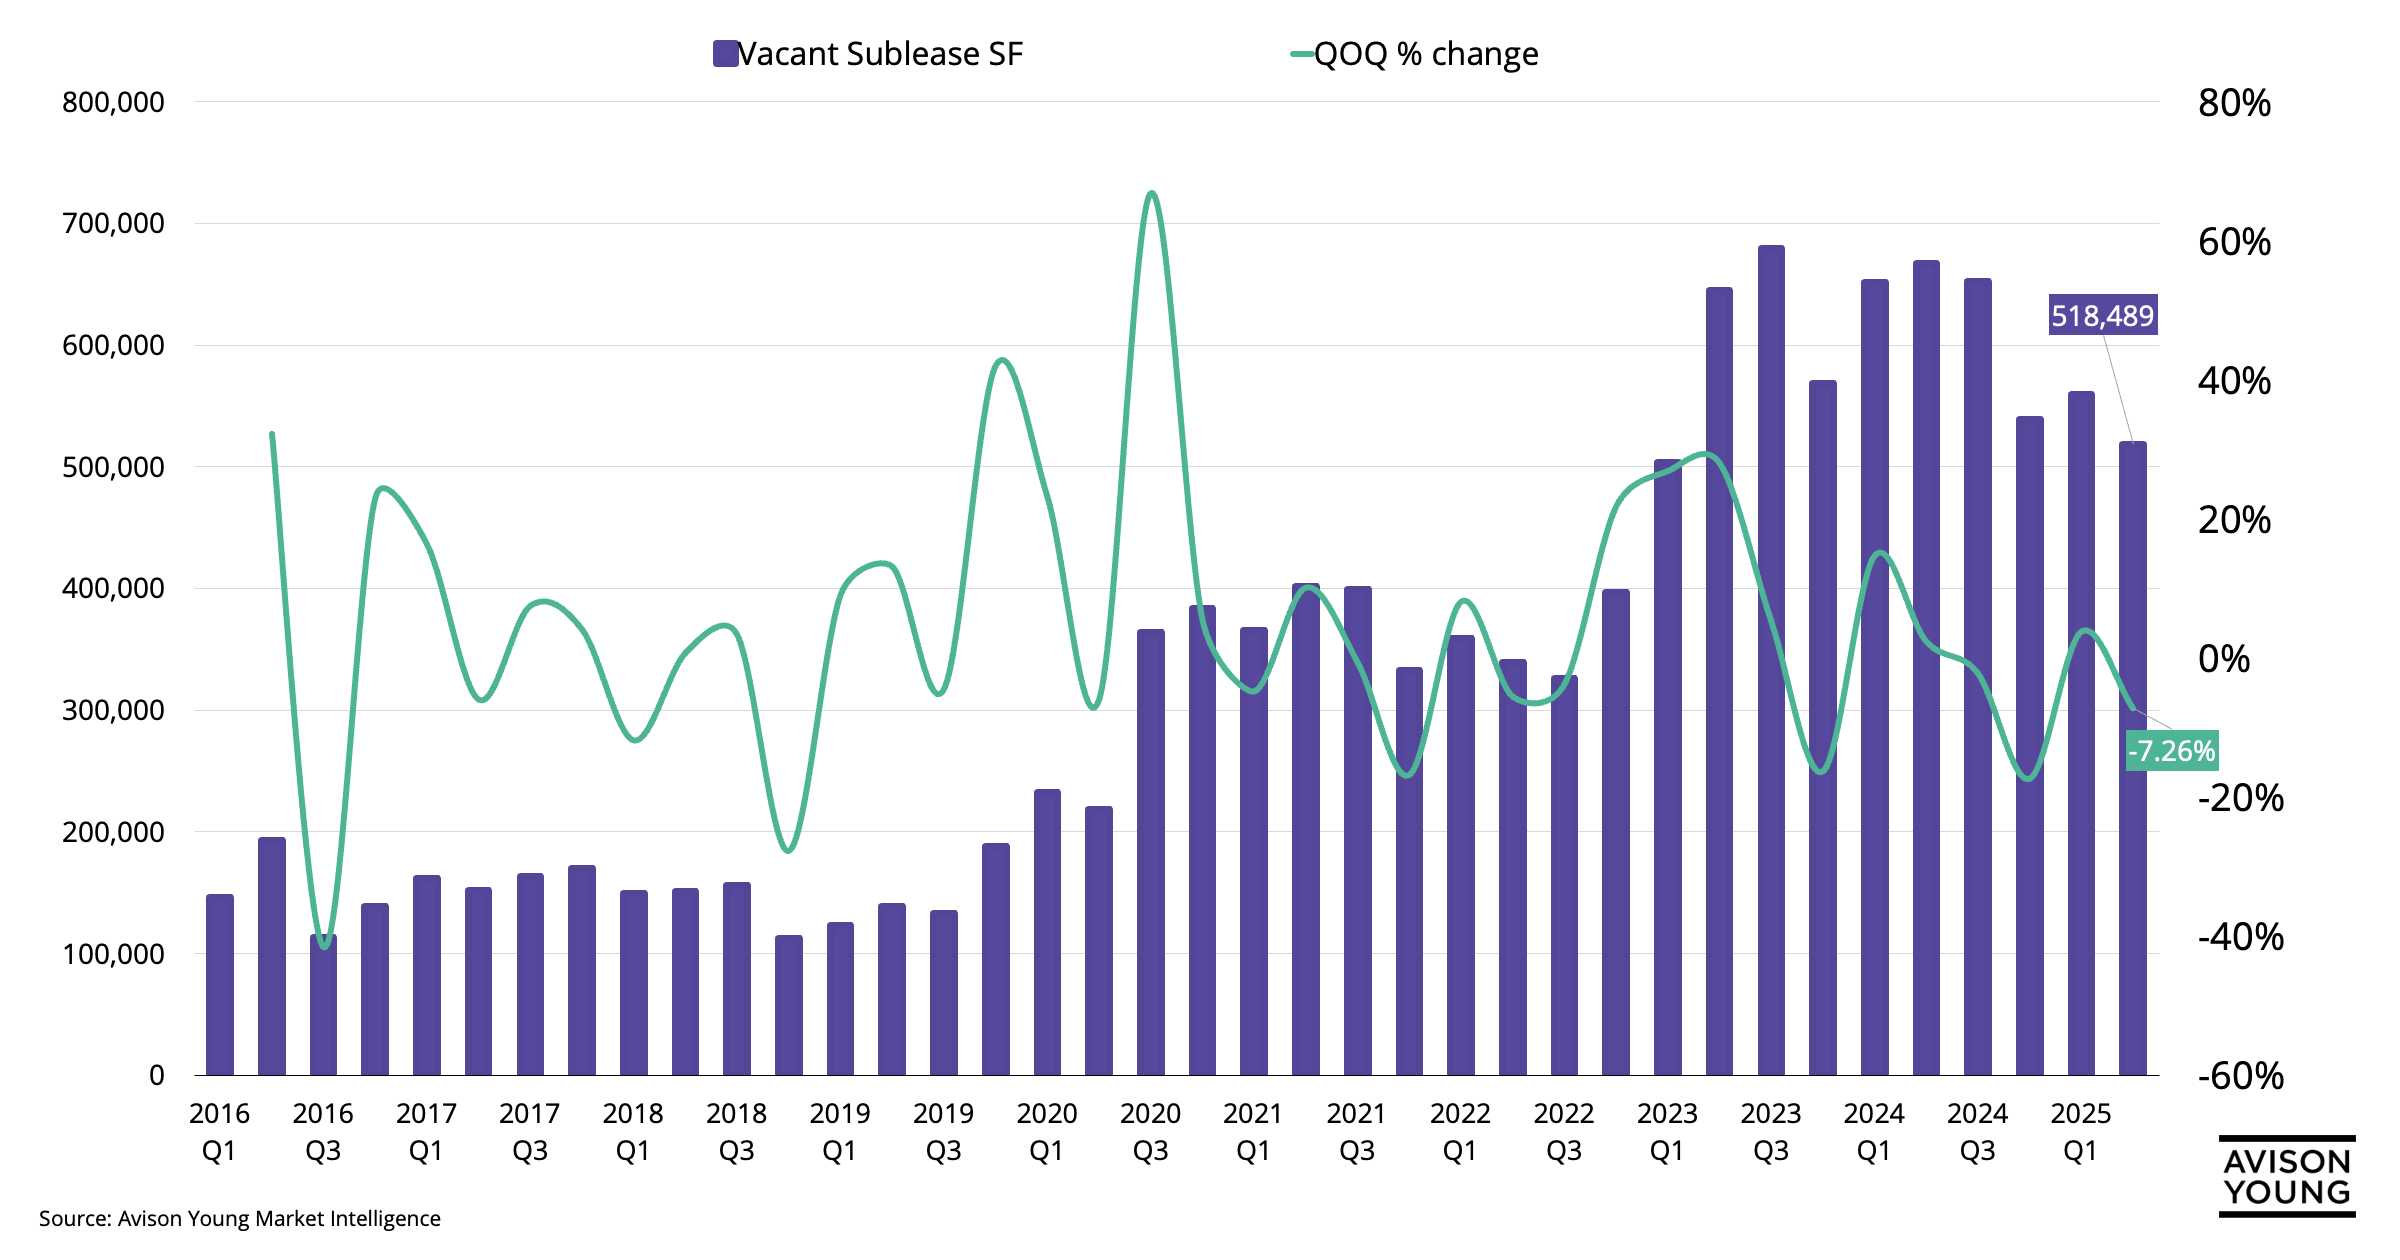
 What’s fueling the shift in Raleigh-Durham’s office sublease market post-COVID?
 -
 Exploring lease rate shifts across Charlotte’s office submarkets
 -
 Owner-User demand sustains retail pricing amid rising vacancy in Los Angeles
 -
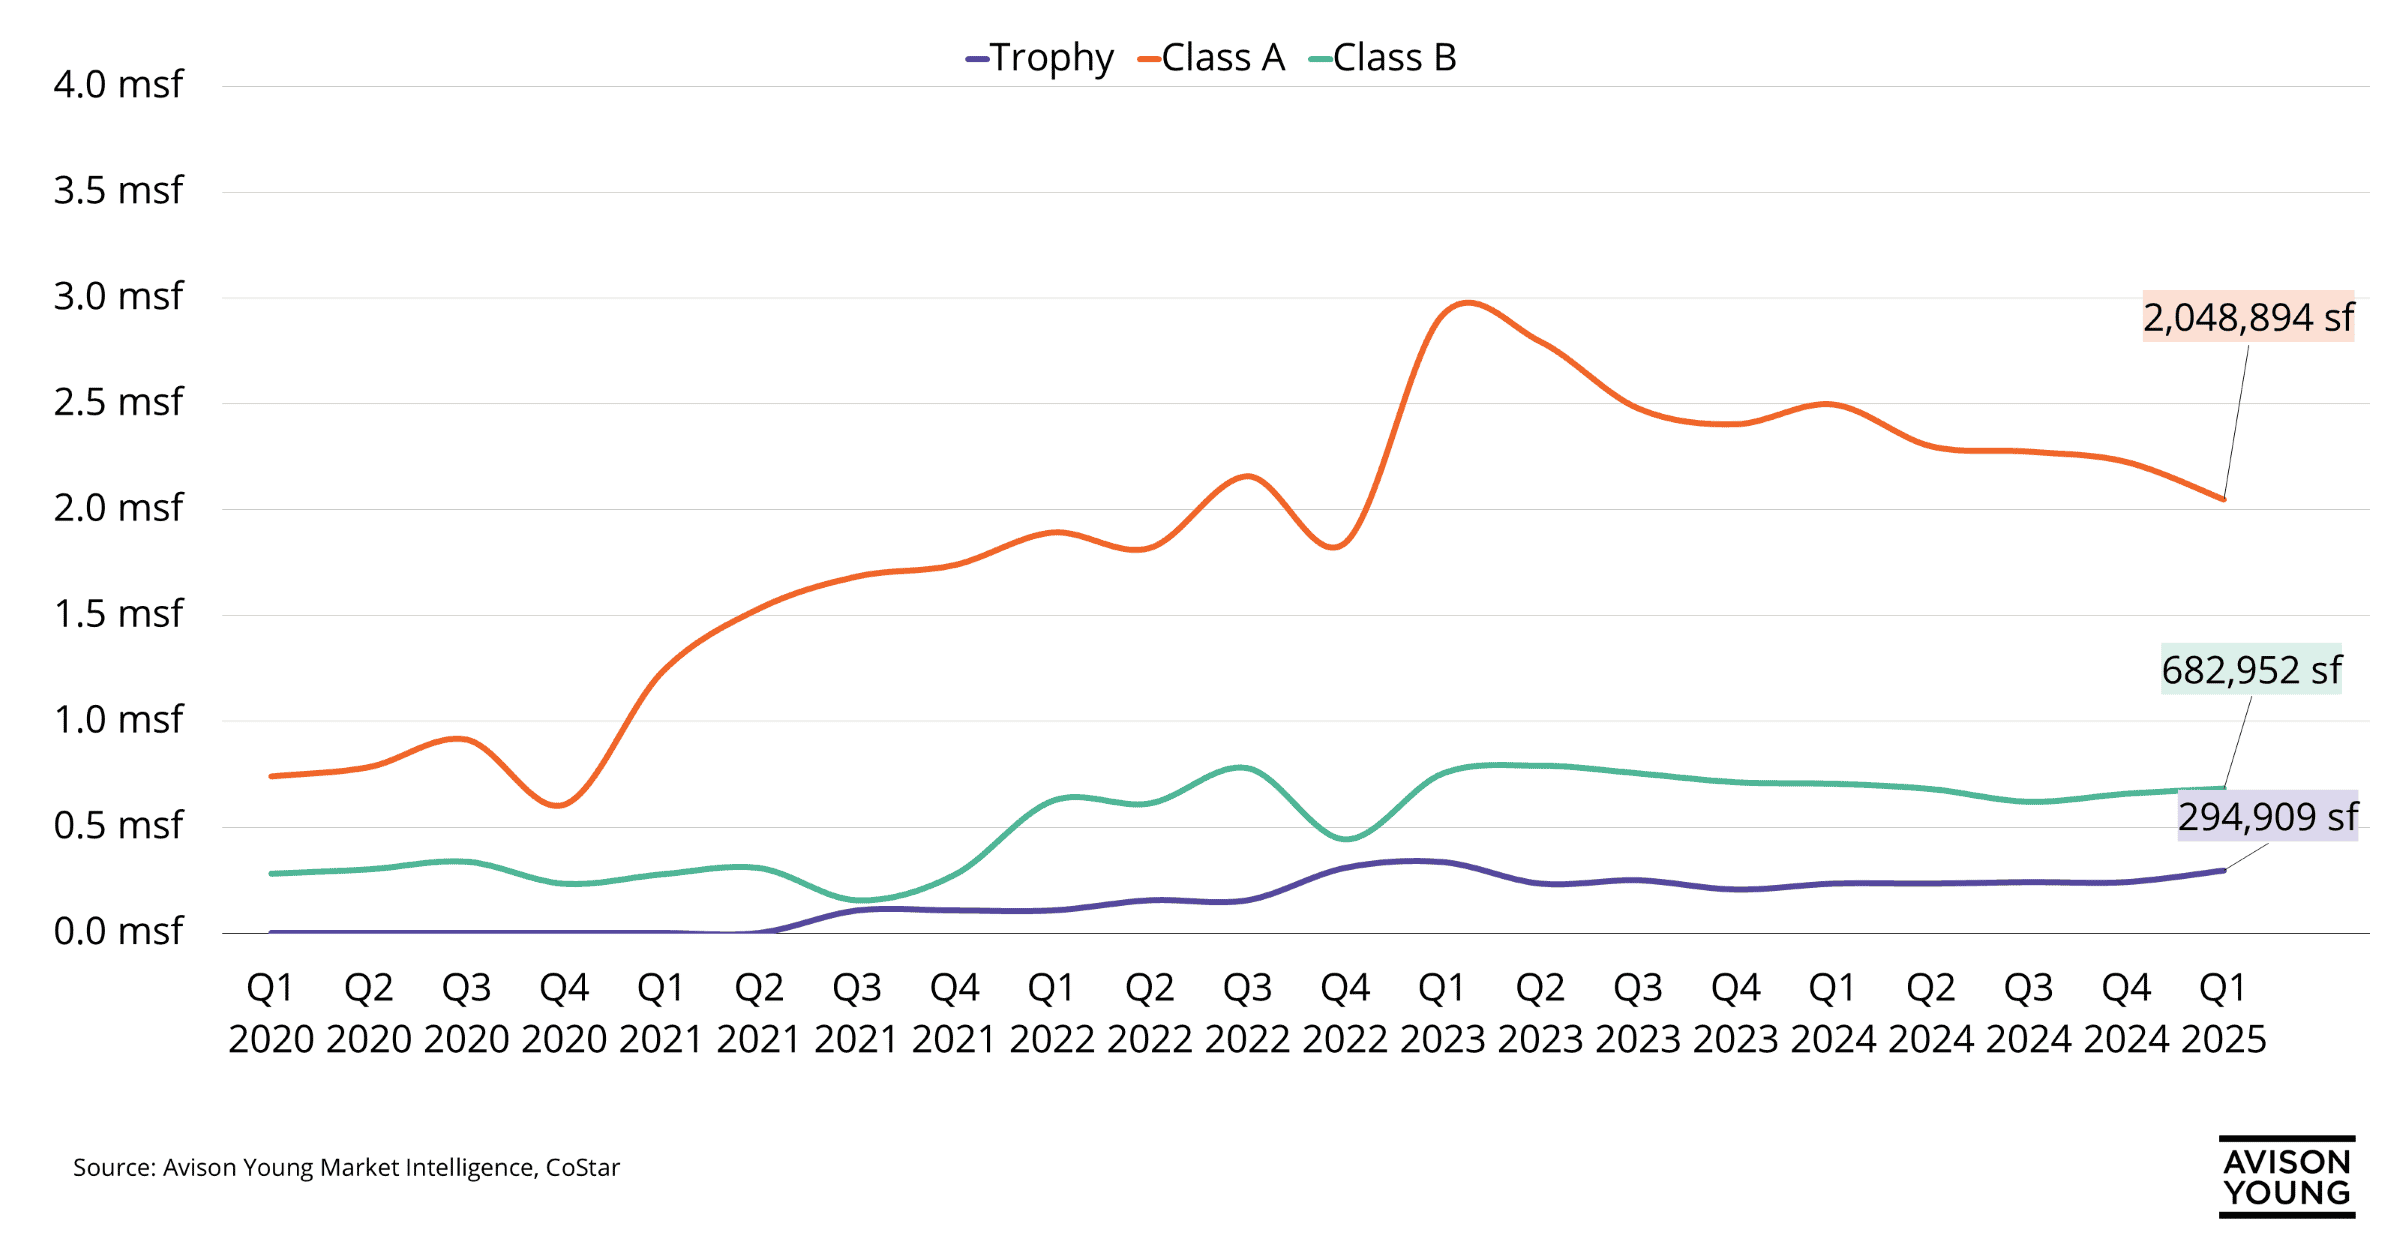
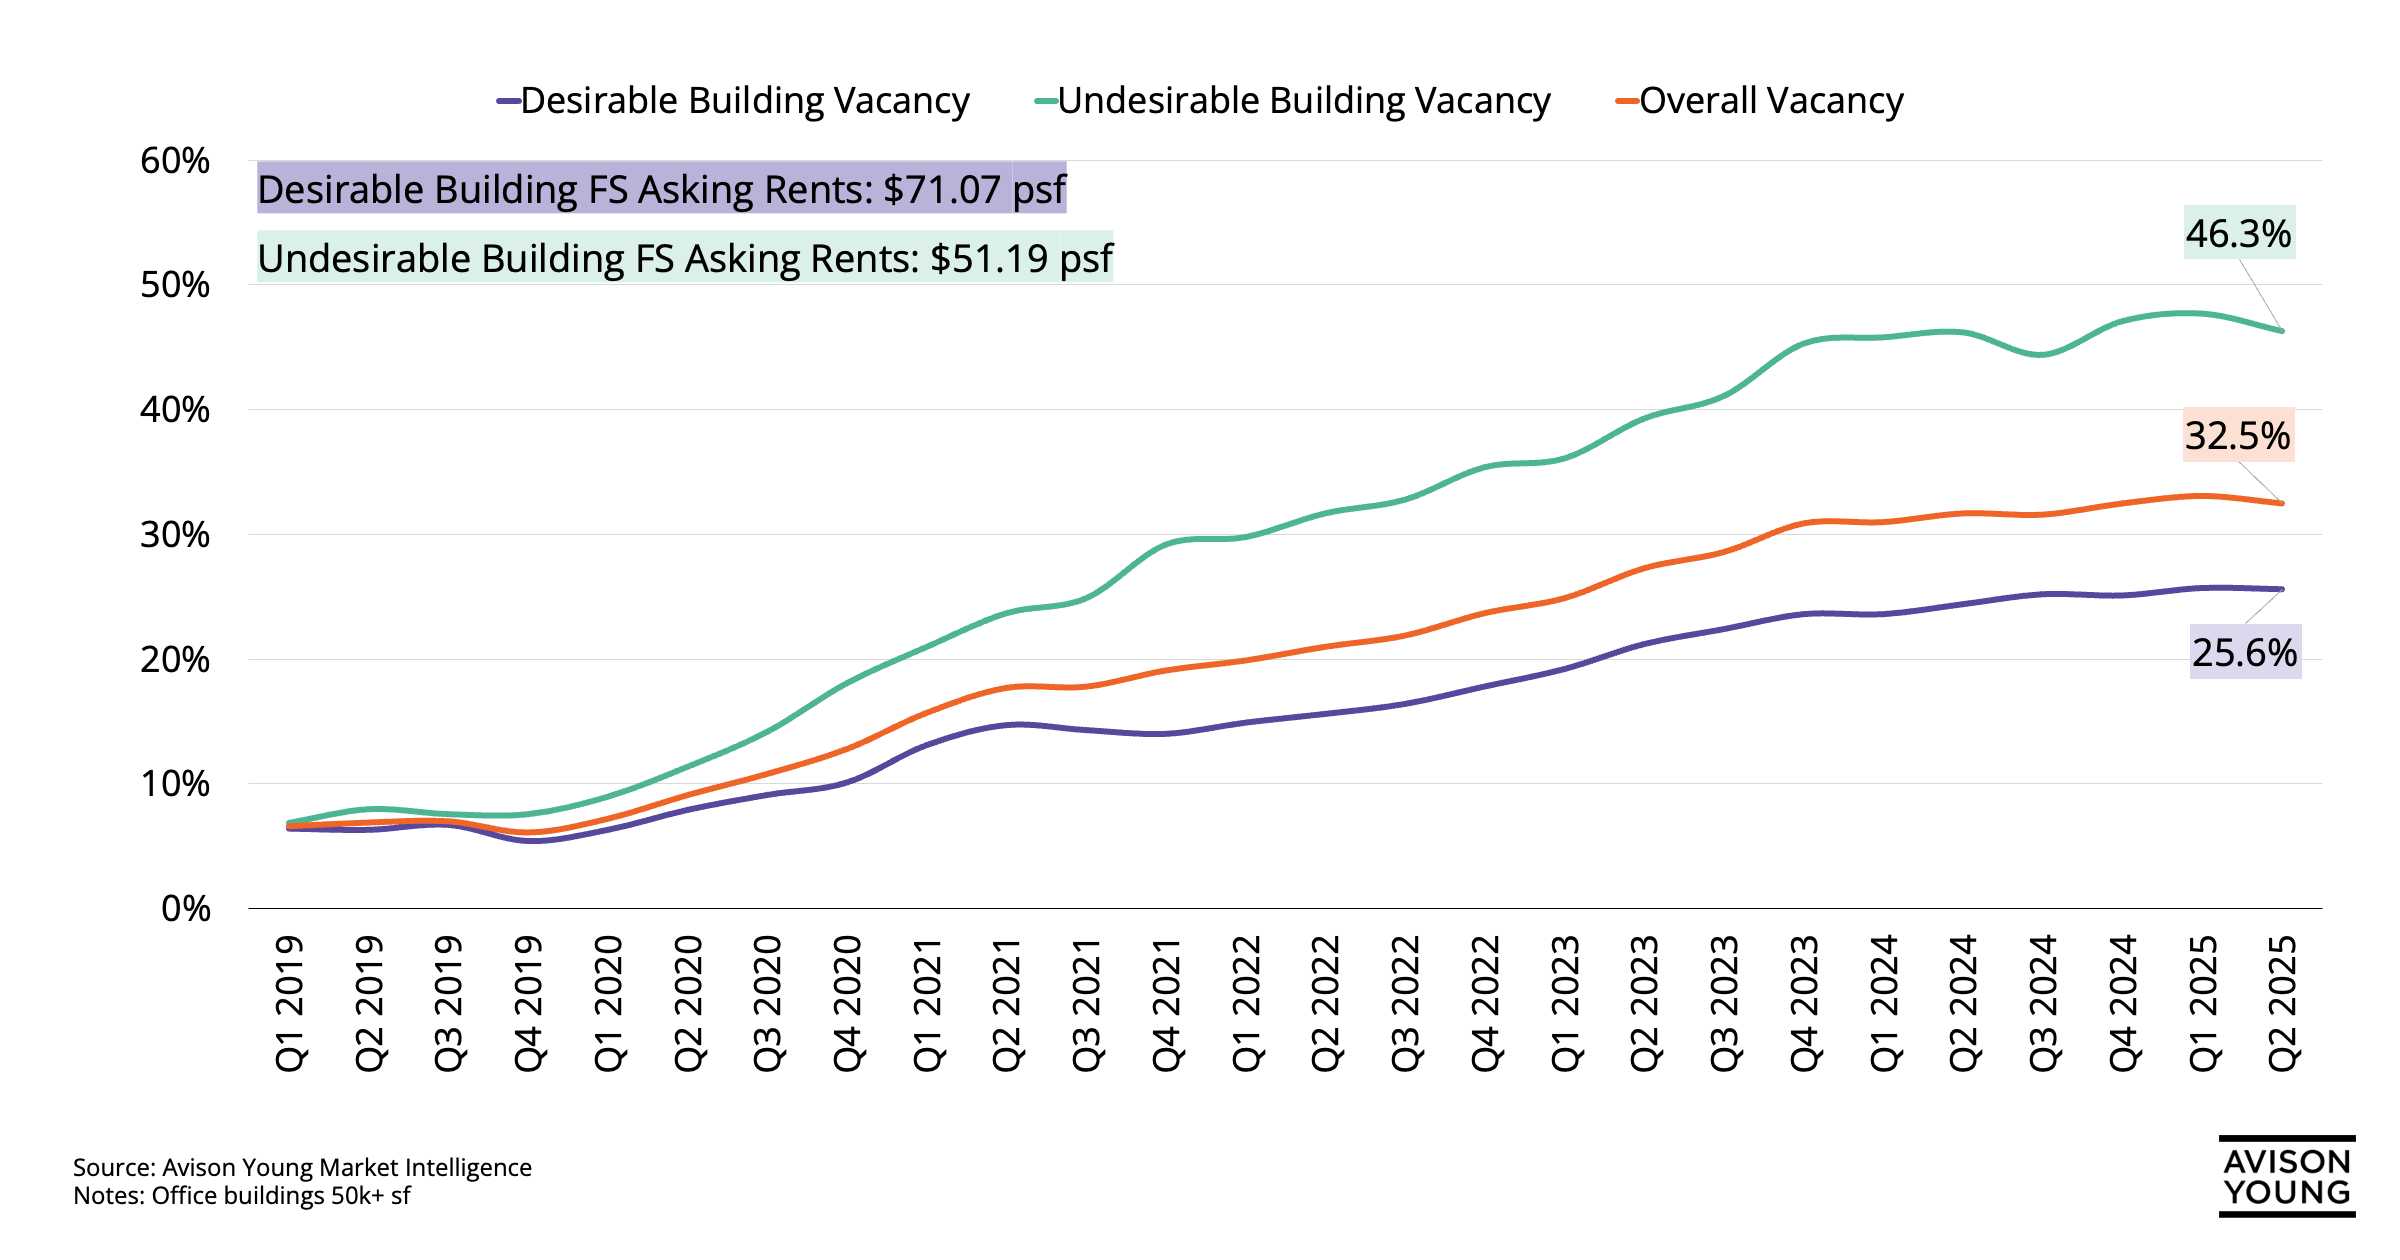 Undesirable assets continue to inflate San Francisco vacancy
 -
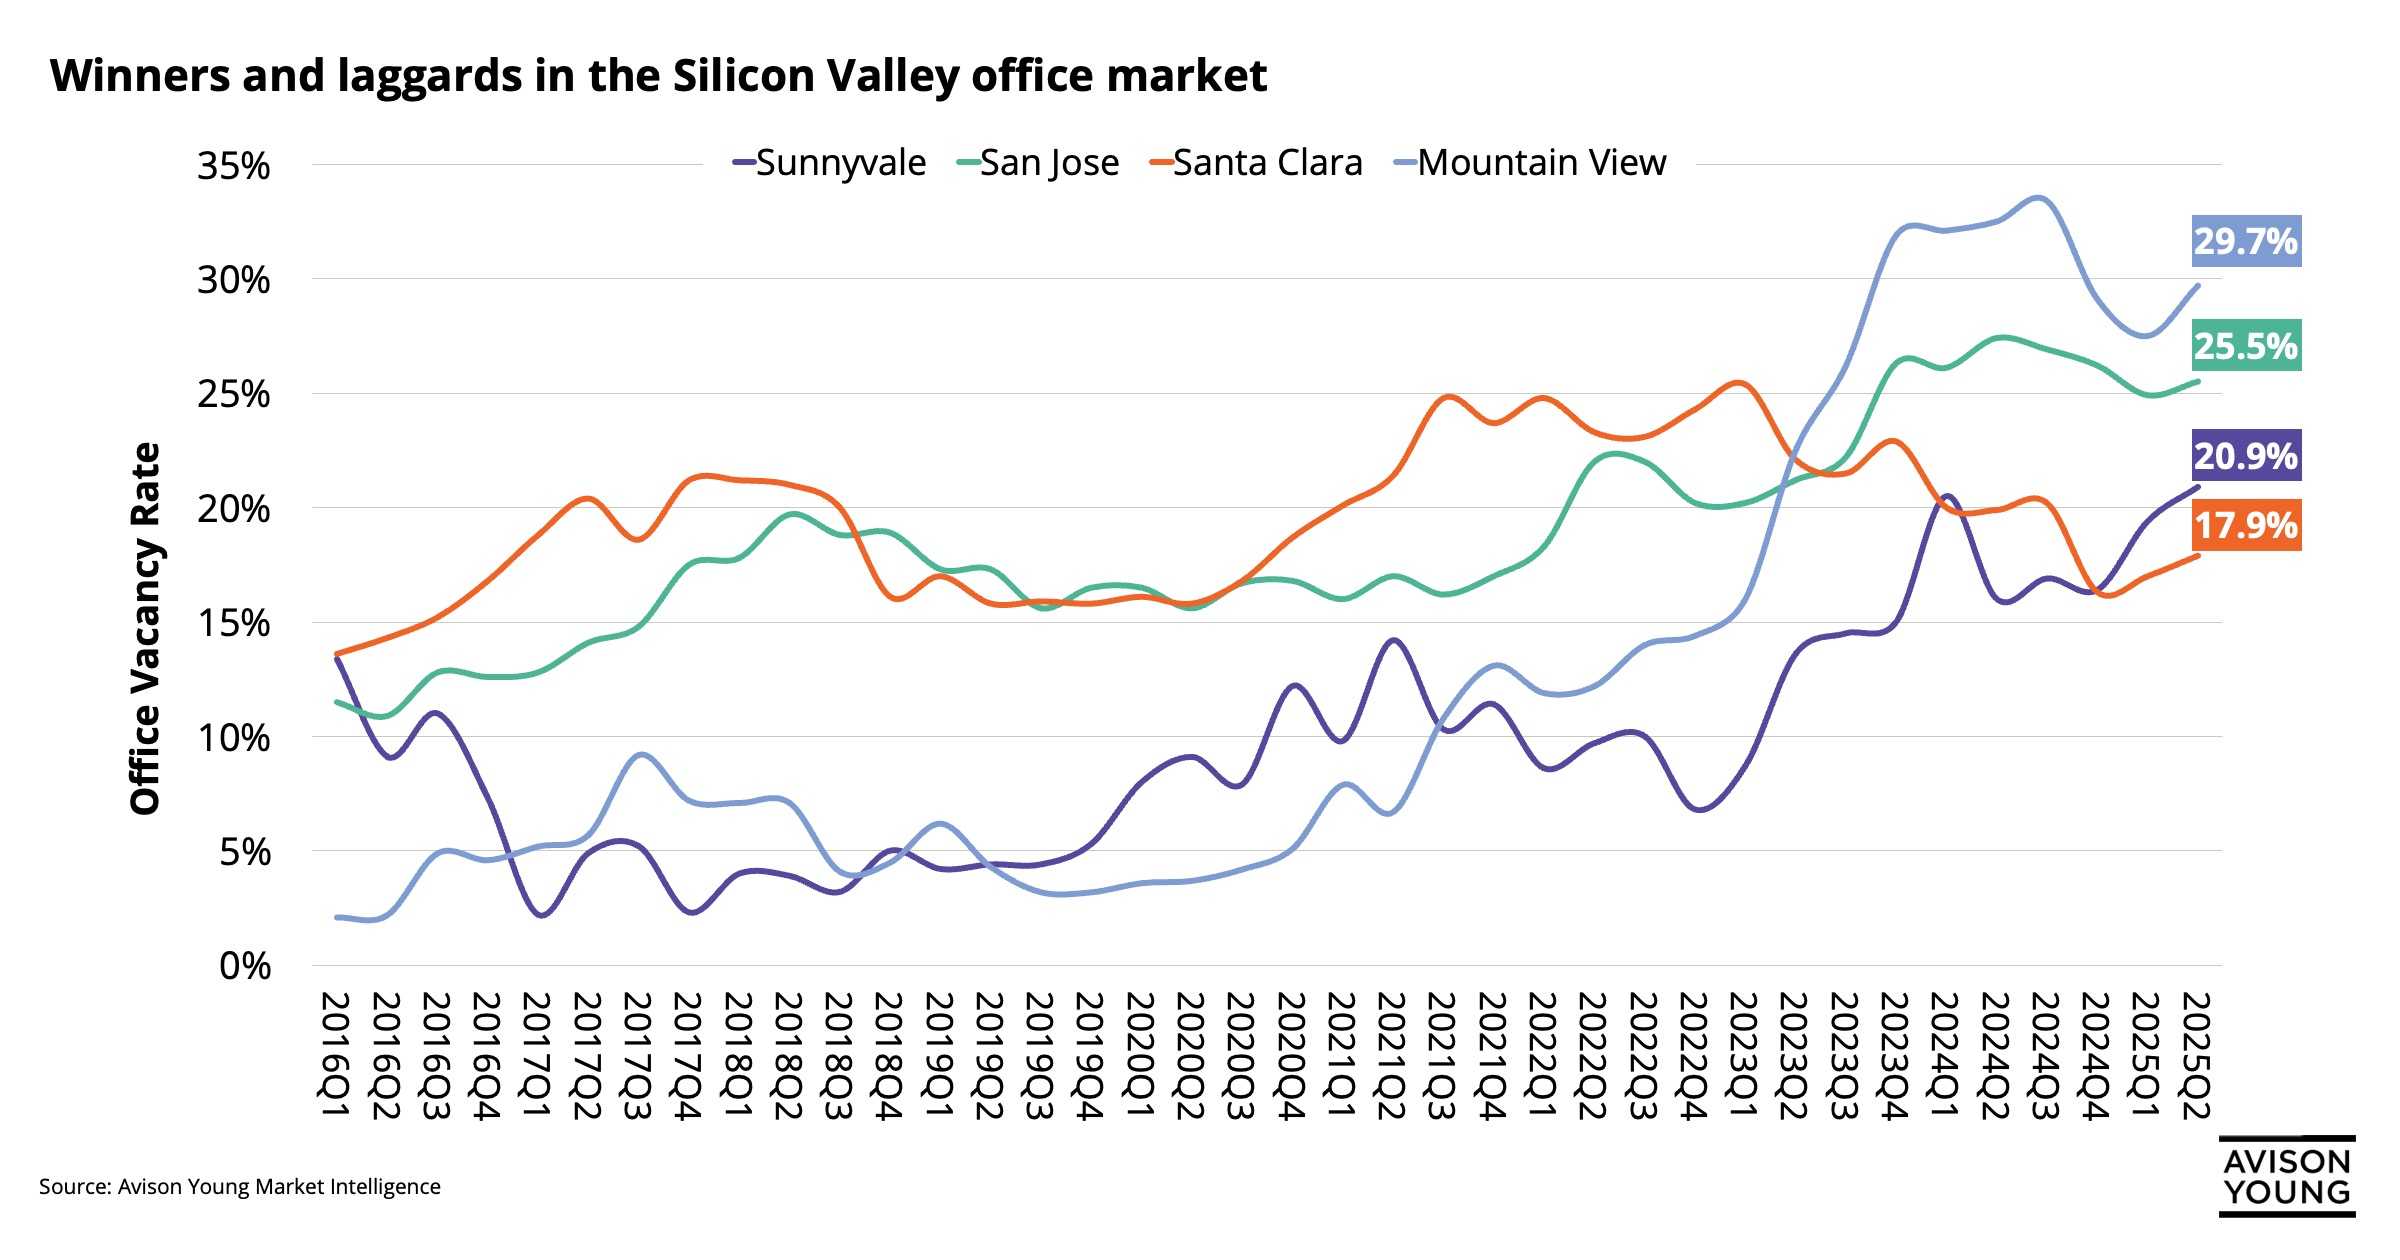 Winners and laggards in the Silicon Valley office market
 -
 April Port Activity Rises, But Tariff Questions Persist
 -
 Vacancy lower in smaller industrial buildings within Greater Boston
 -
 DFW’s shopping center sector – where did all the development go?
 -
 Houston’s industrial landscape: Big-box vacancies climb while small-bay thrives
 -
 Tech talent in demand: The top U.S. cities driving AI’s hiring boom
 -
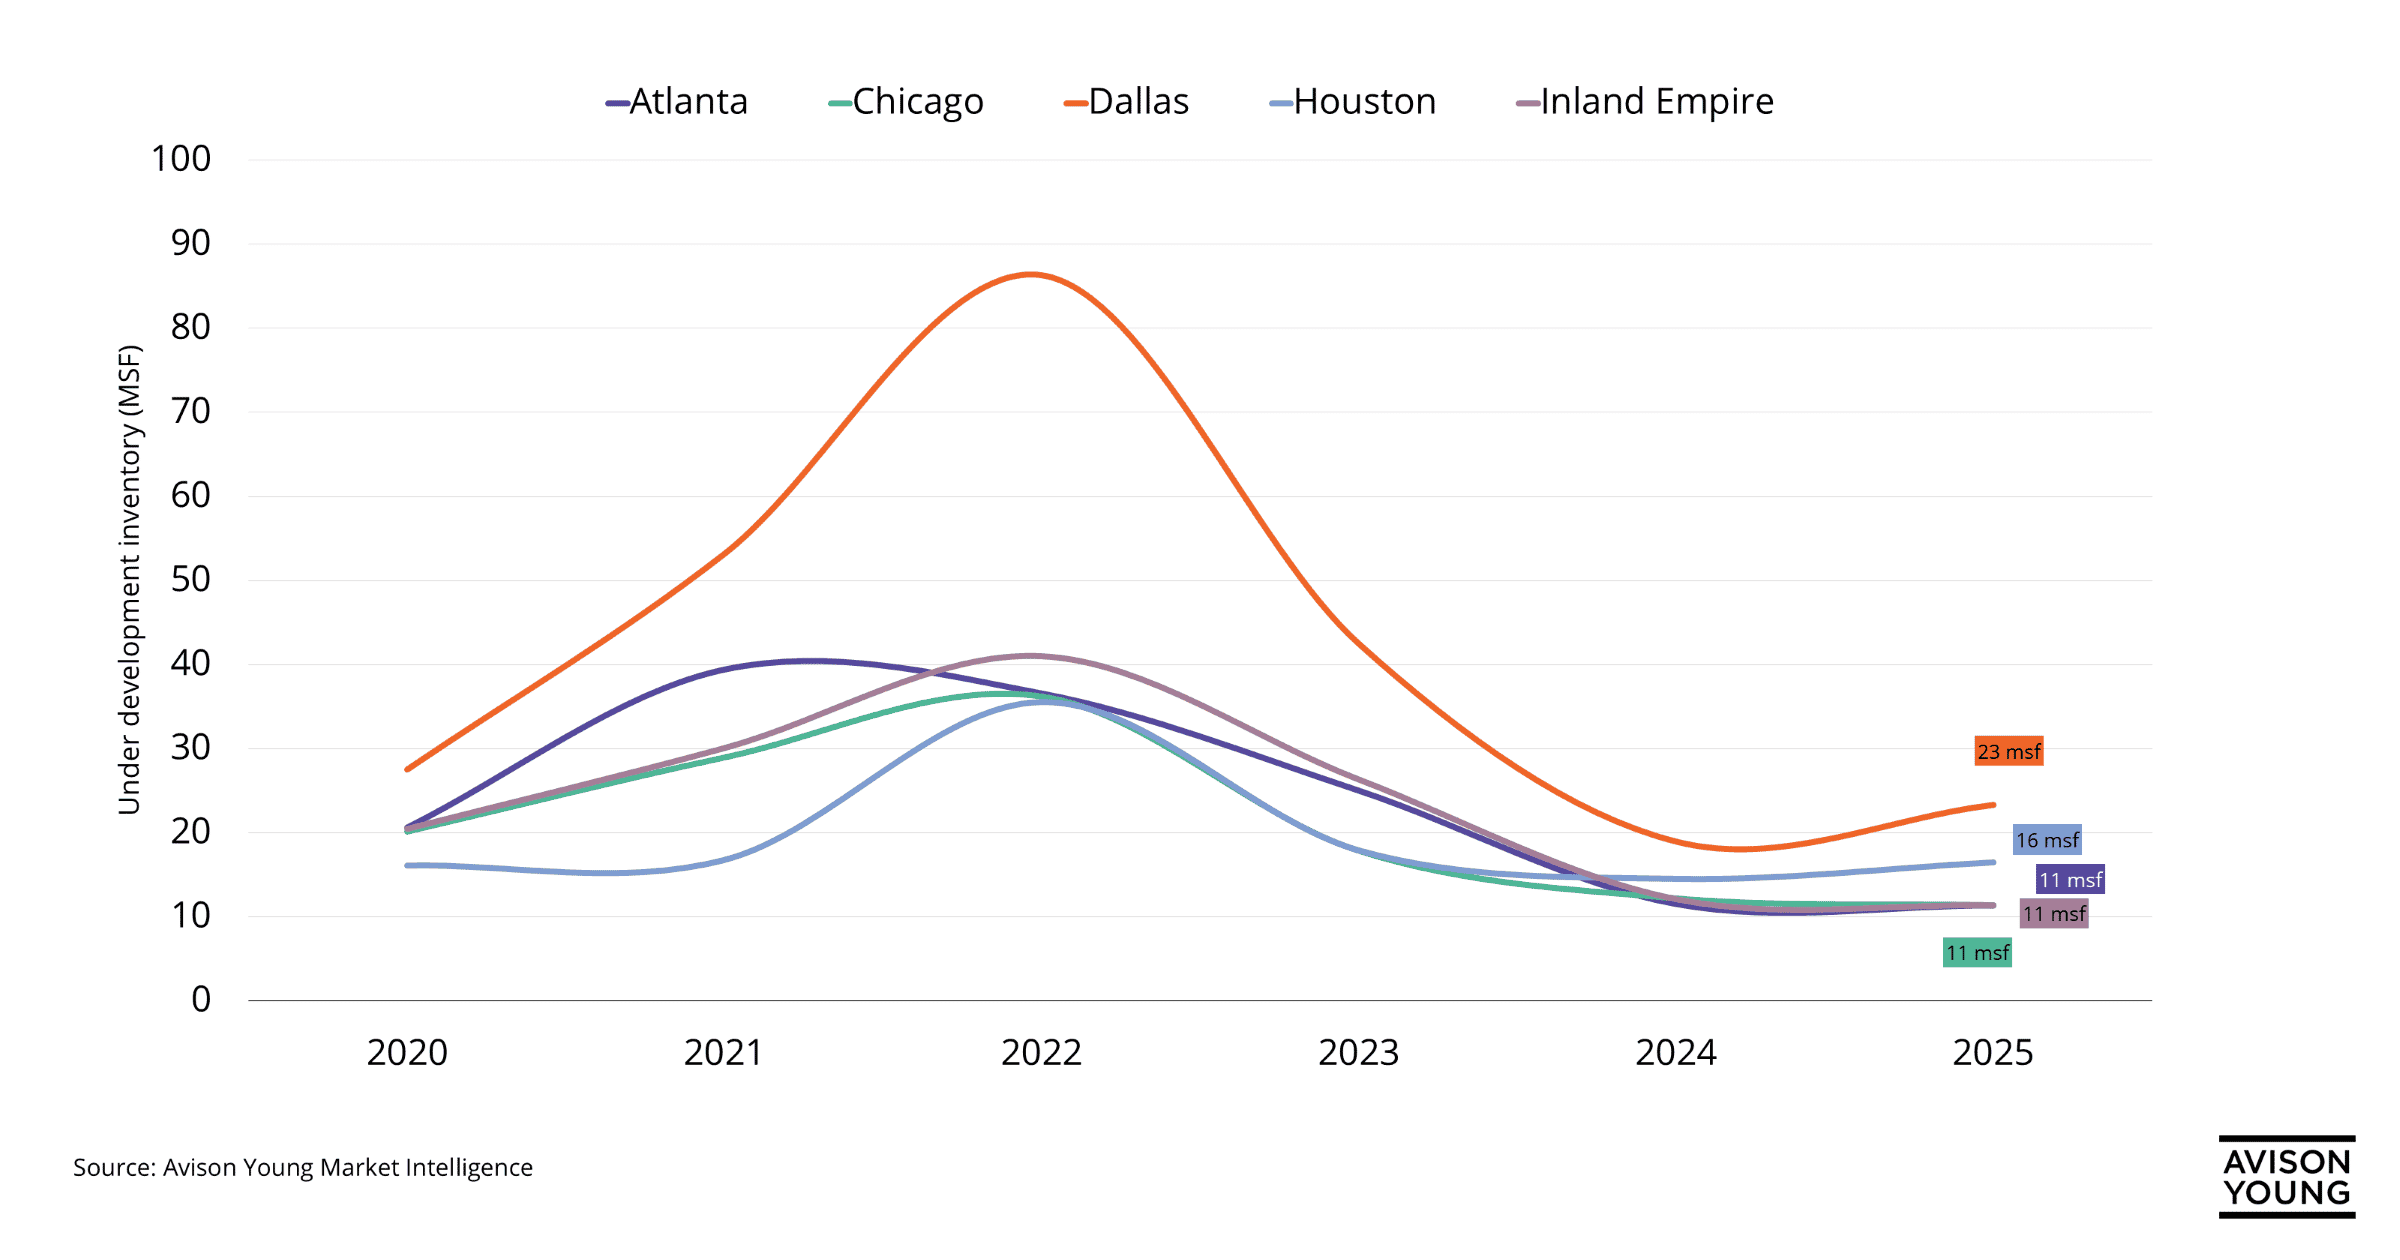 Atlanta’s industrial pipeline rightsizing after record-breaking years of development
 -
[60].jpg/c0758e34-5c3b-b0d5-43df-c3a34abc9d2b?t=1749576480363) MSP office visitation is notably bifurcated by asset class
MSP office visitation is notably bifurcated by asset class -
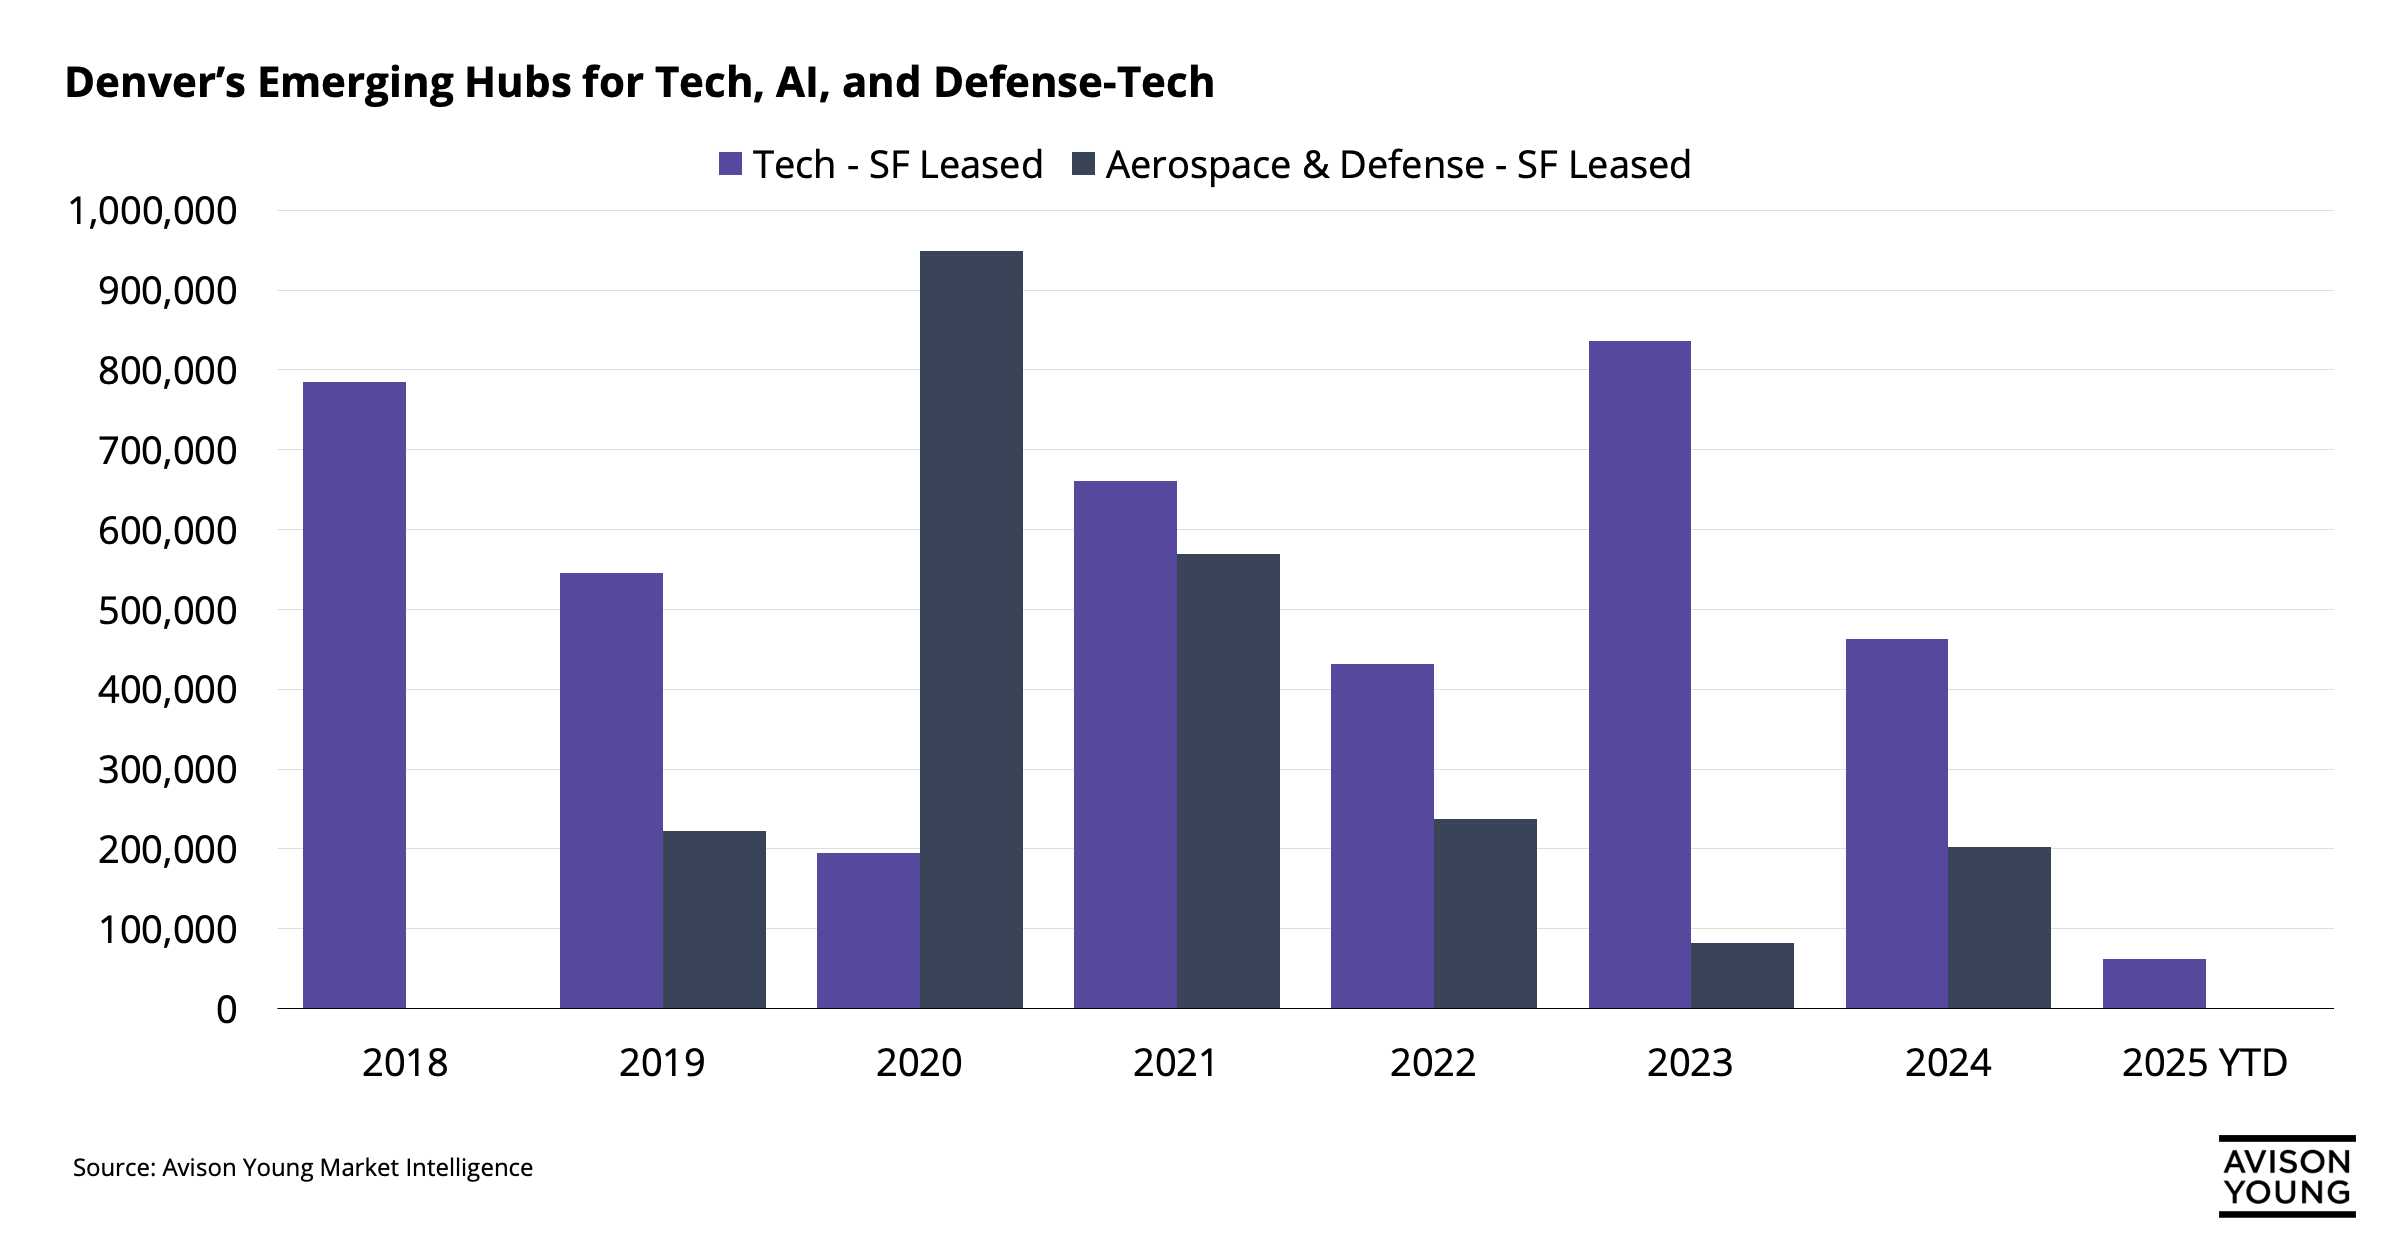 Tracking the rise of tech and defense in Denver CRE
 -
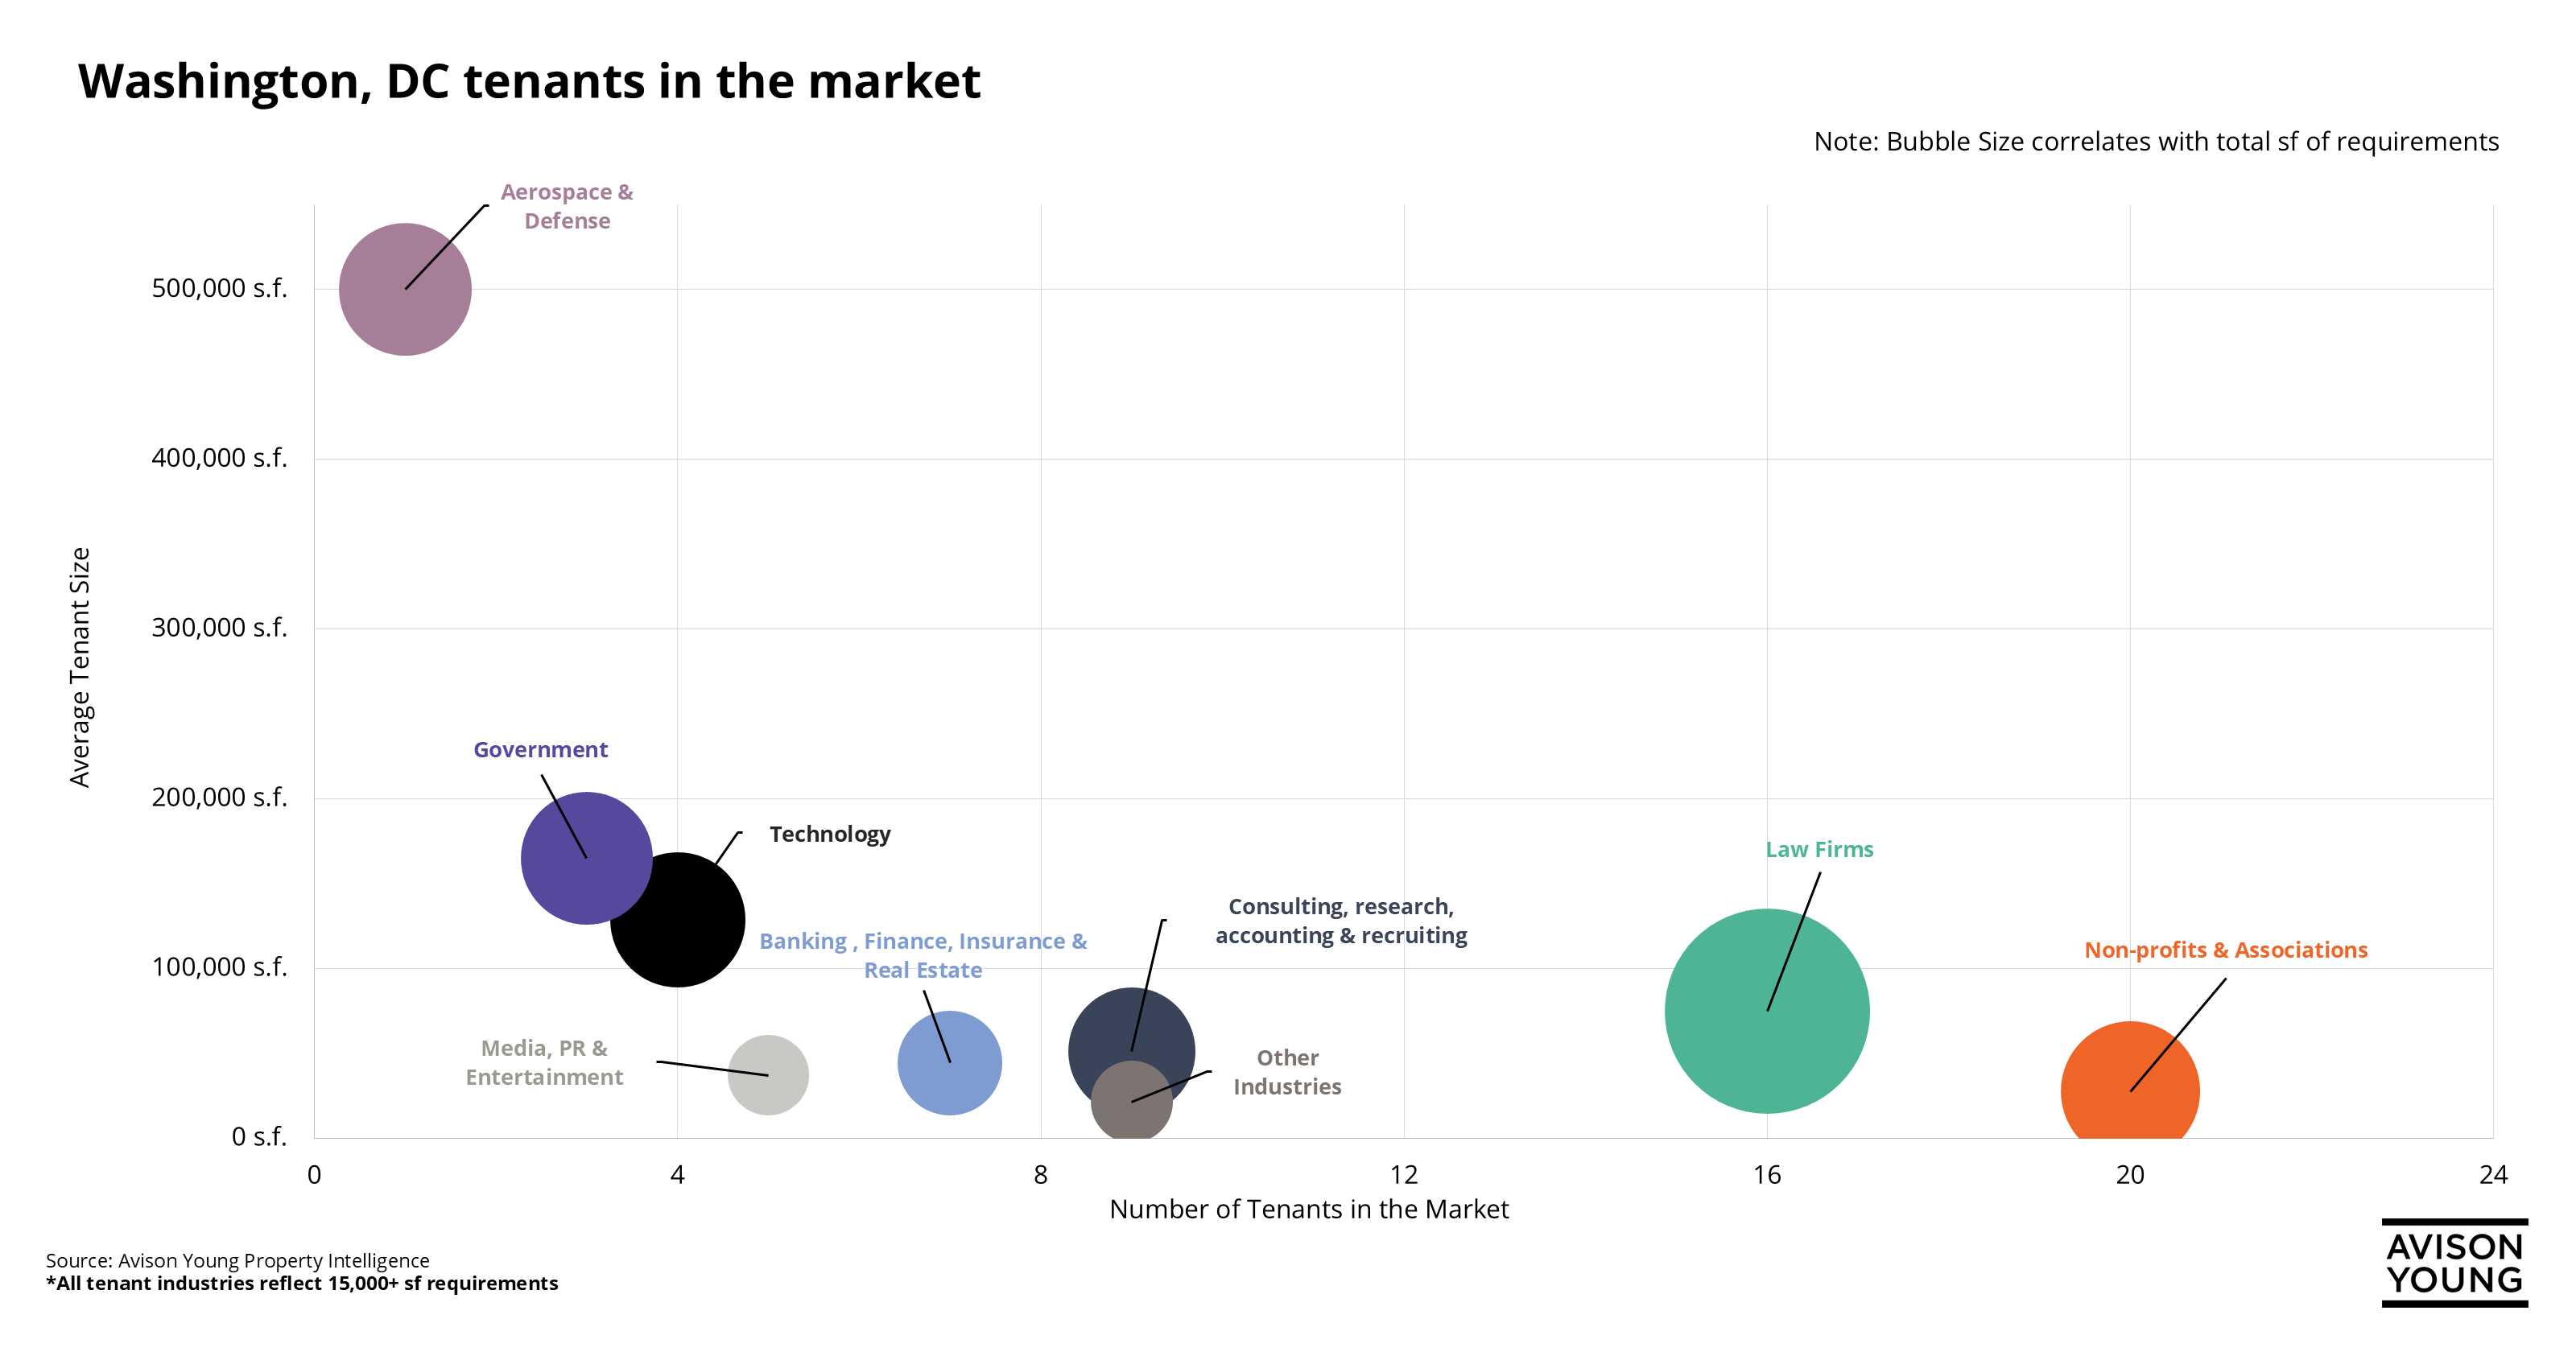 Law firms lead office space demand in Washington, DC
 -
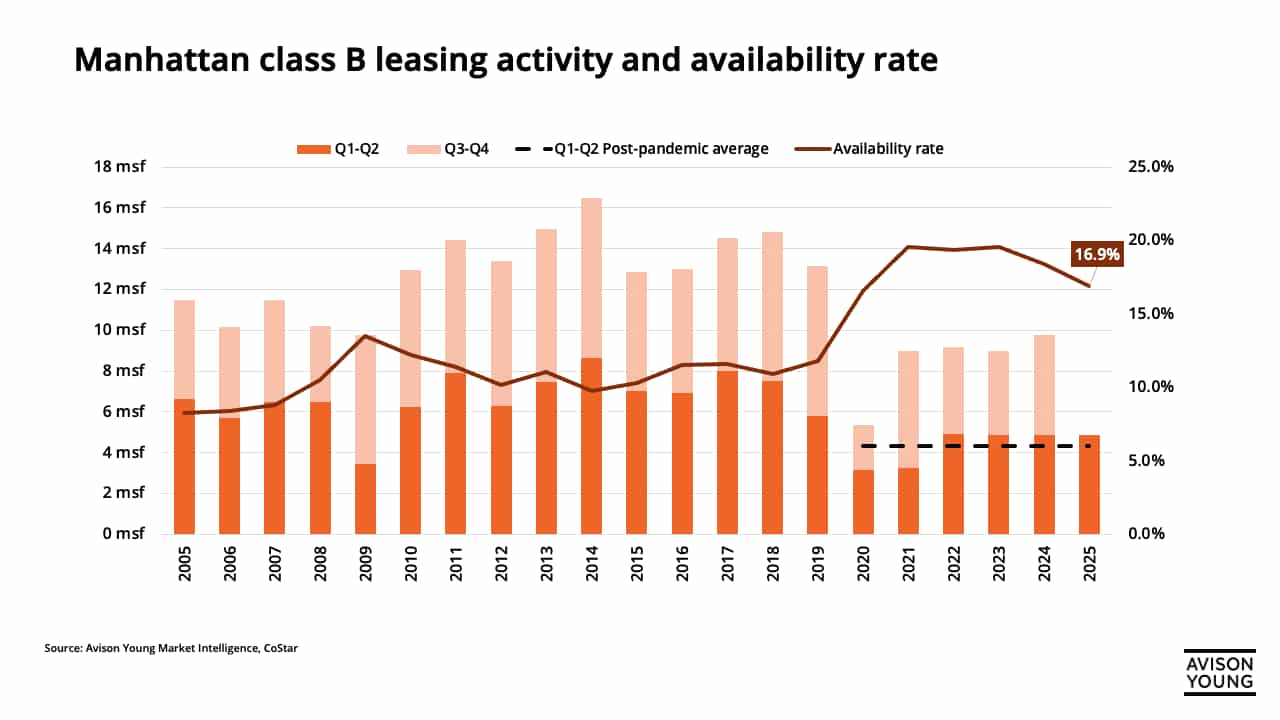 Strong start to 2025 for Manhattan class B leasing activity
 -
 Demand disparity: Financial services drive tenant requirements in Chicago CBD with tech and consulting to follow
 -
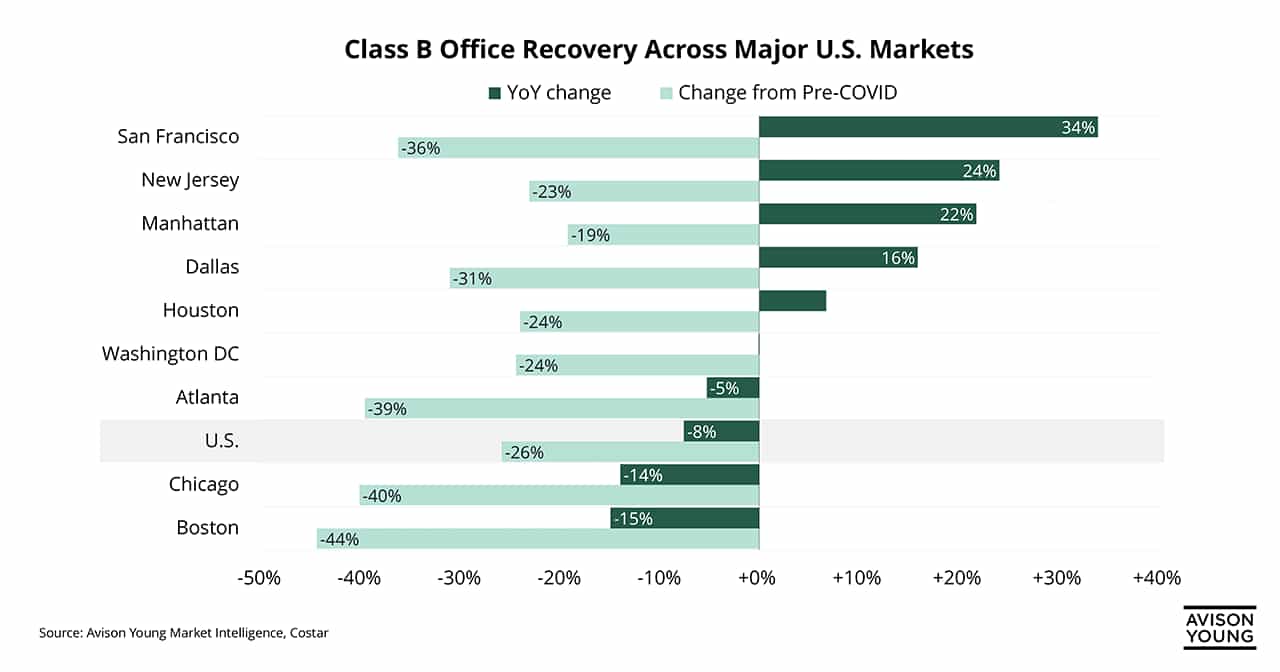
 Which U.S. office markets are seeing a class B rebound?
 -
 Strong occupancy, stronger rents: Post-COVID realities in Fort Lauderdale industrial's market
 -
 Miami continues to lead the next phase of industrial growth across Florida’s core markets
 -
 Across the Philadelphia industrial market developers continue to scale down as demand drives shift toward 50K–249K SF projects
 -
 Law firms drive largest YoY growth in Boston office leasing
 -
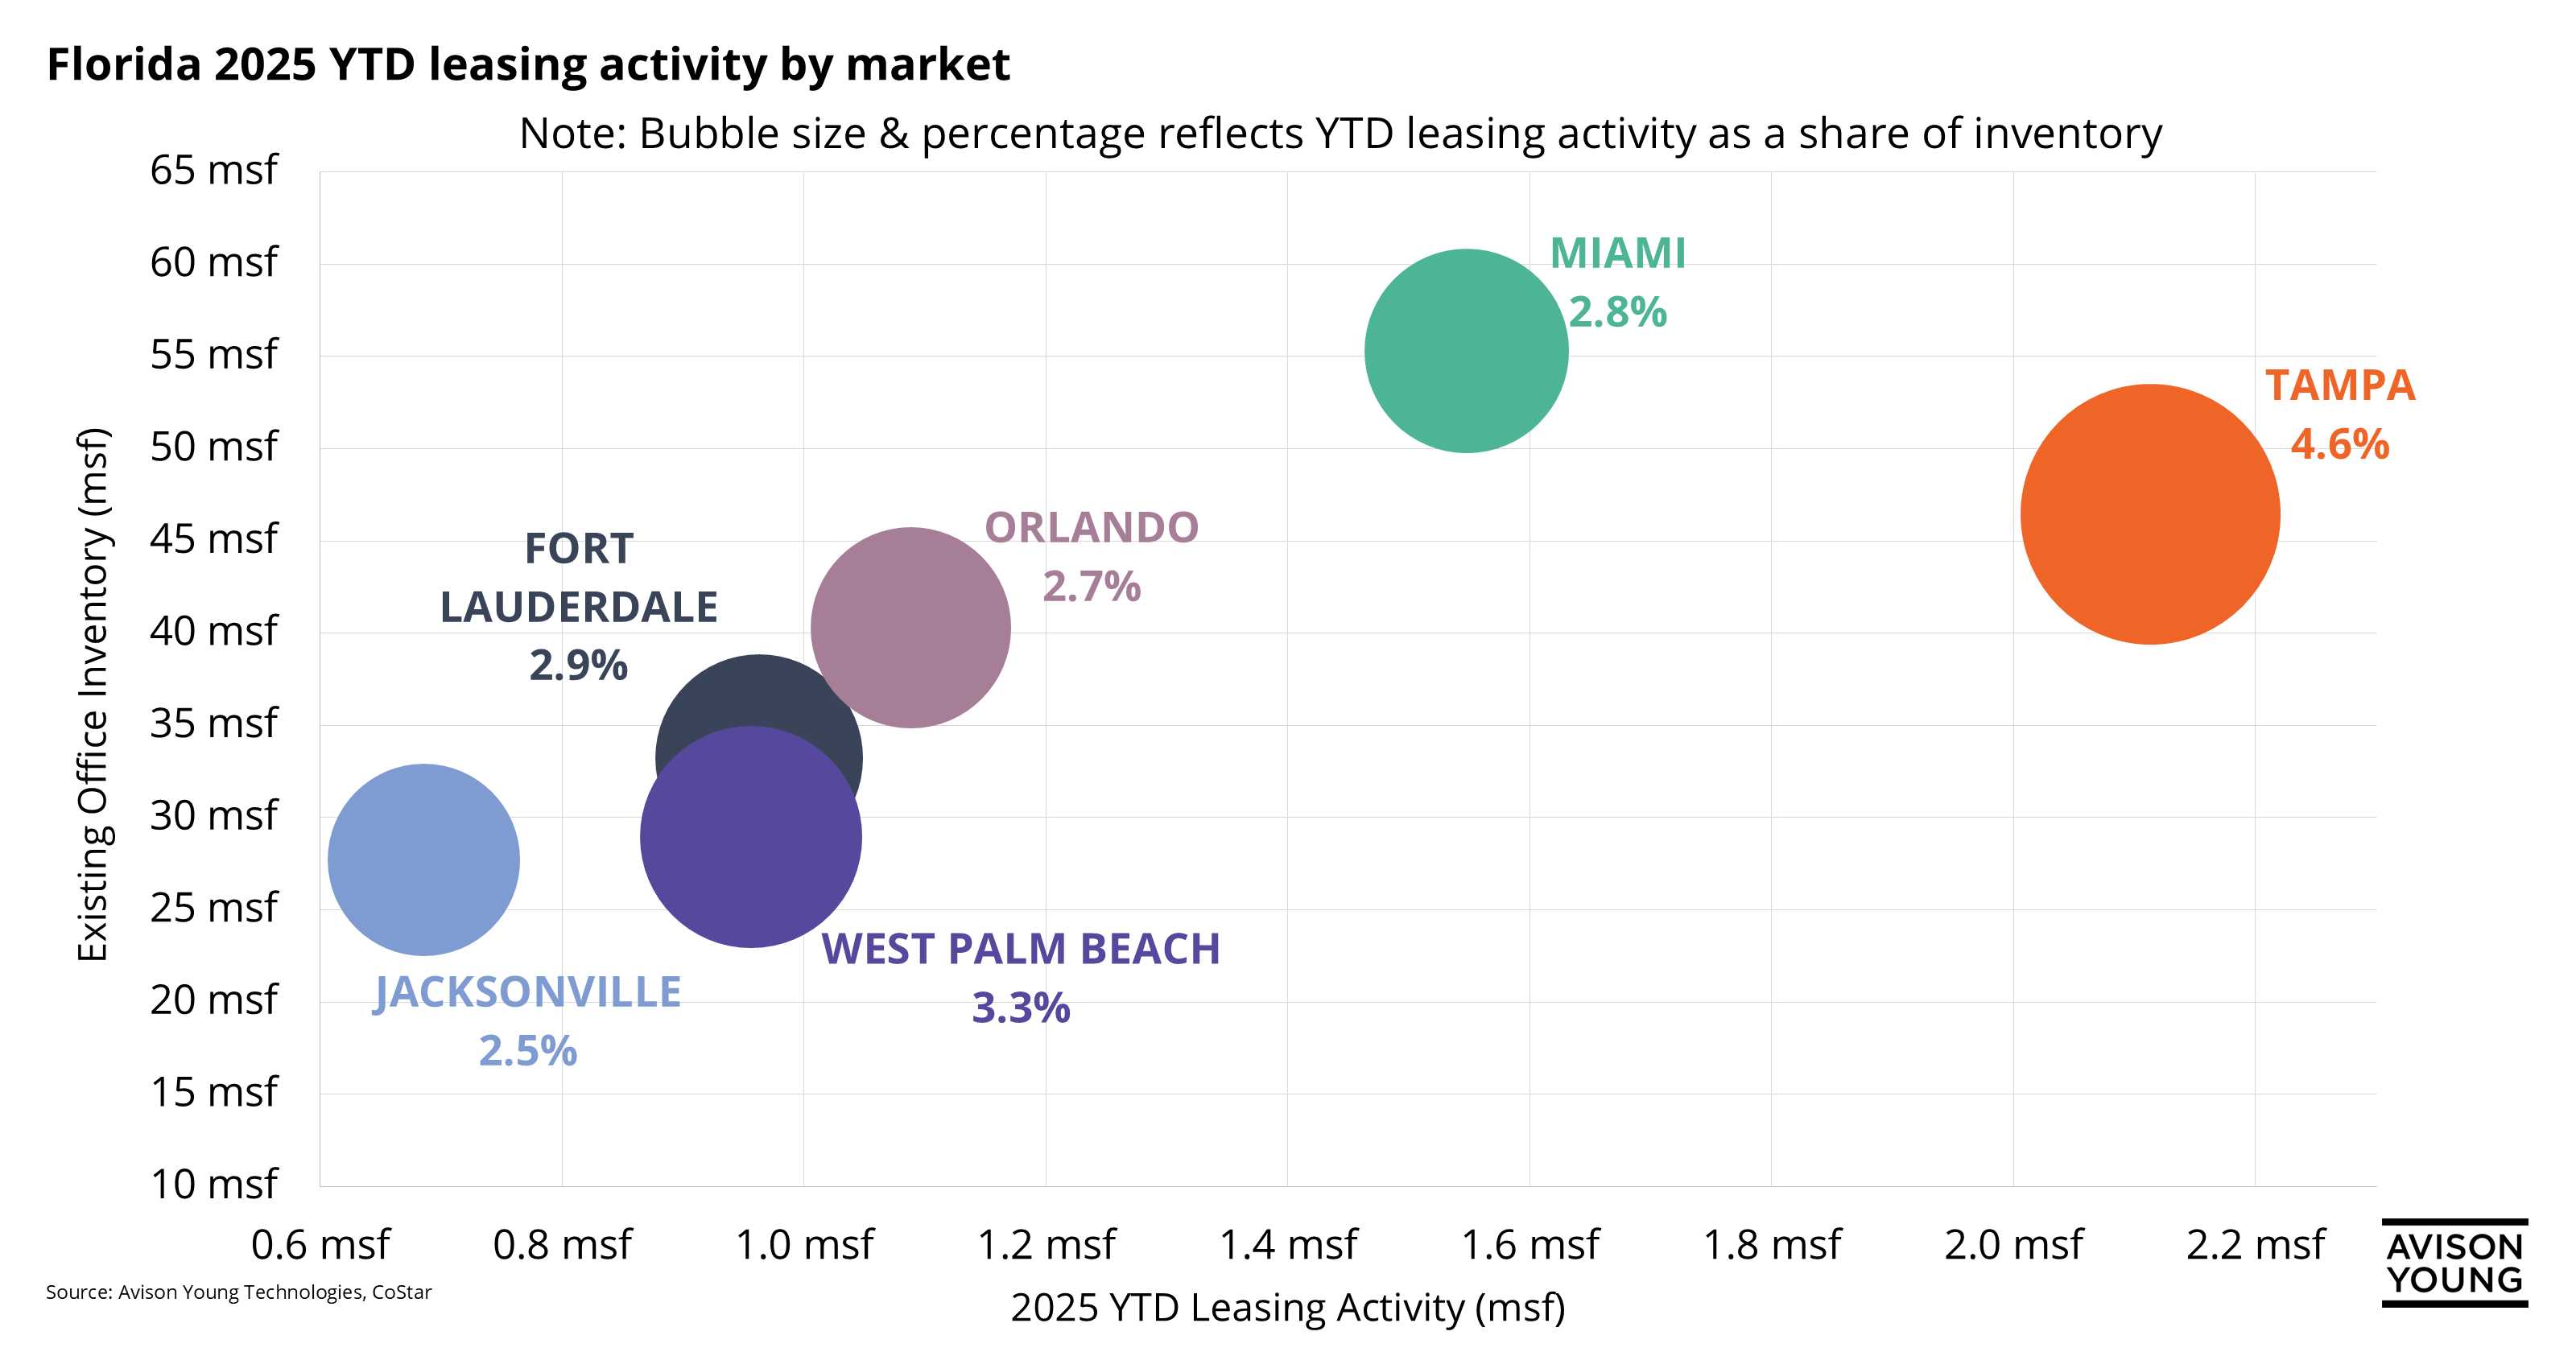 Tampa sees strongest office leasing activity in first five months of 2025
 -
 Hiring hustle: Chicago’s Industrial sector shifts into high gear
 -
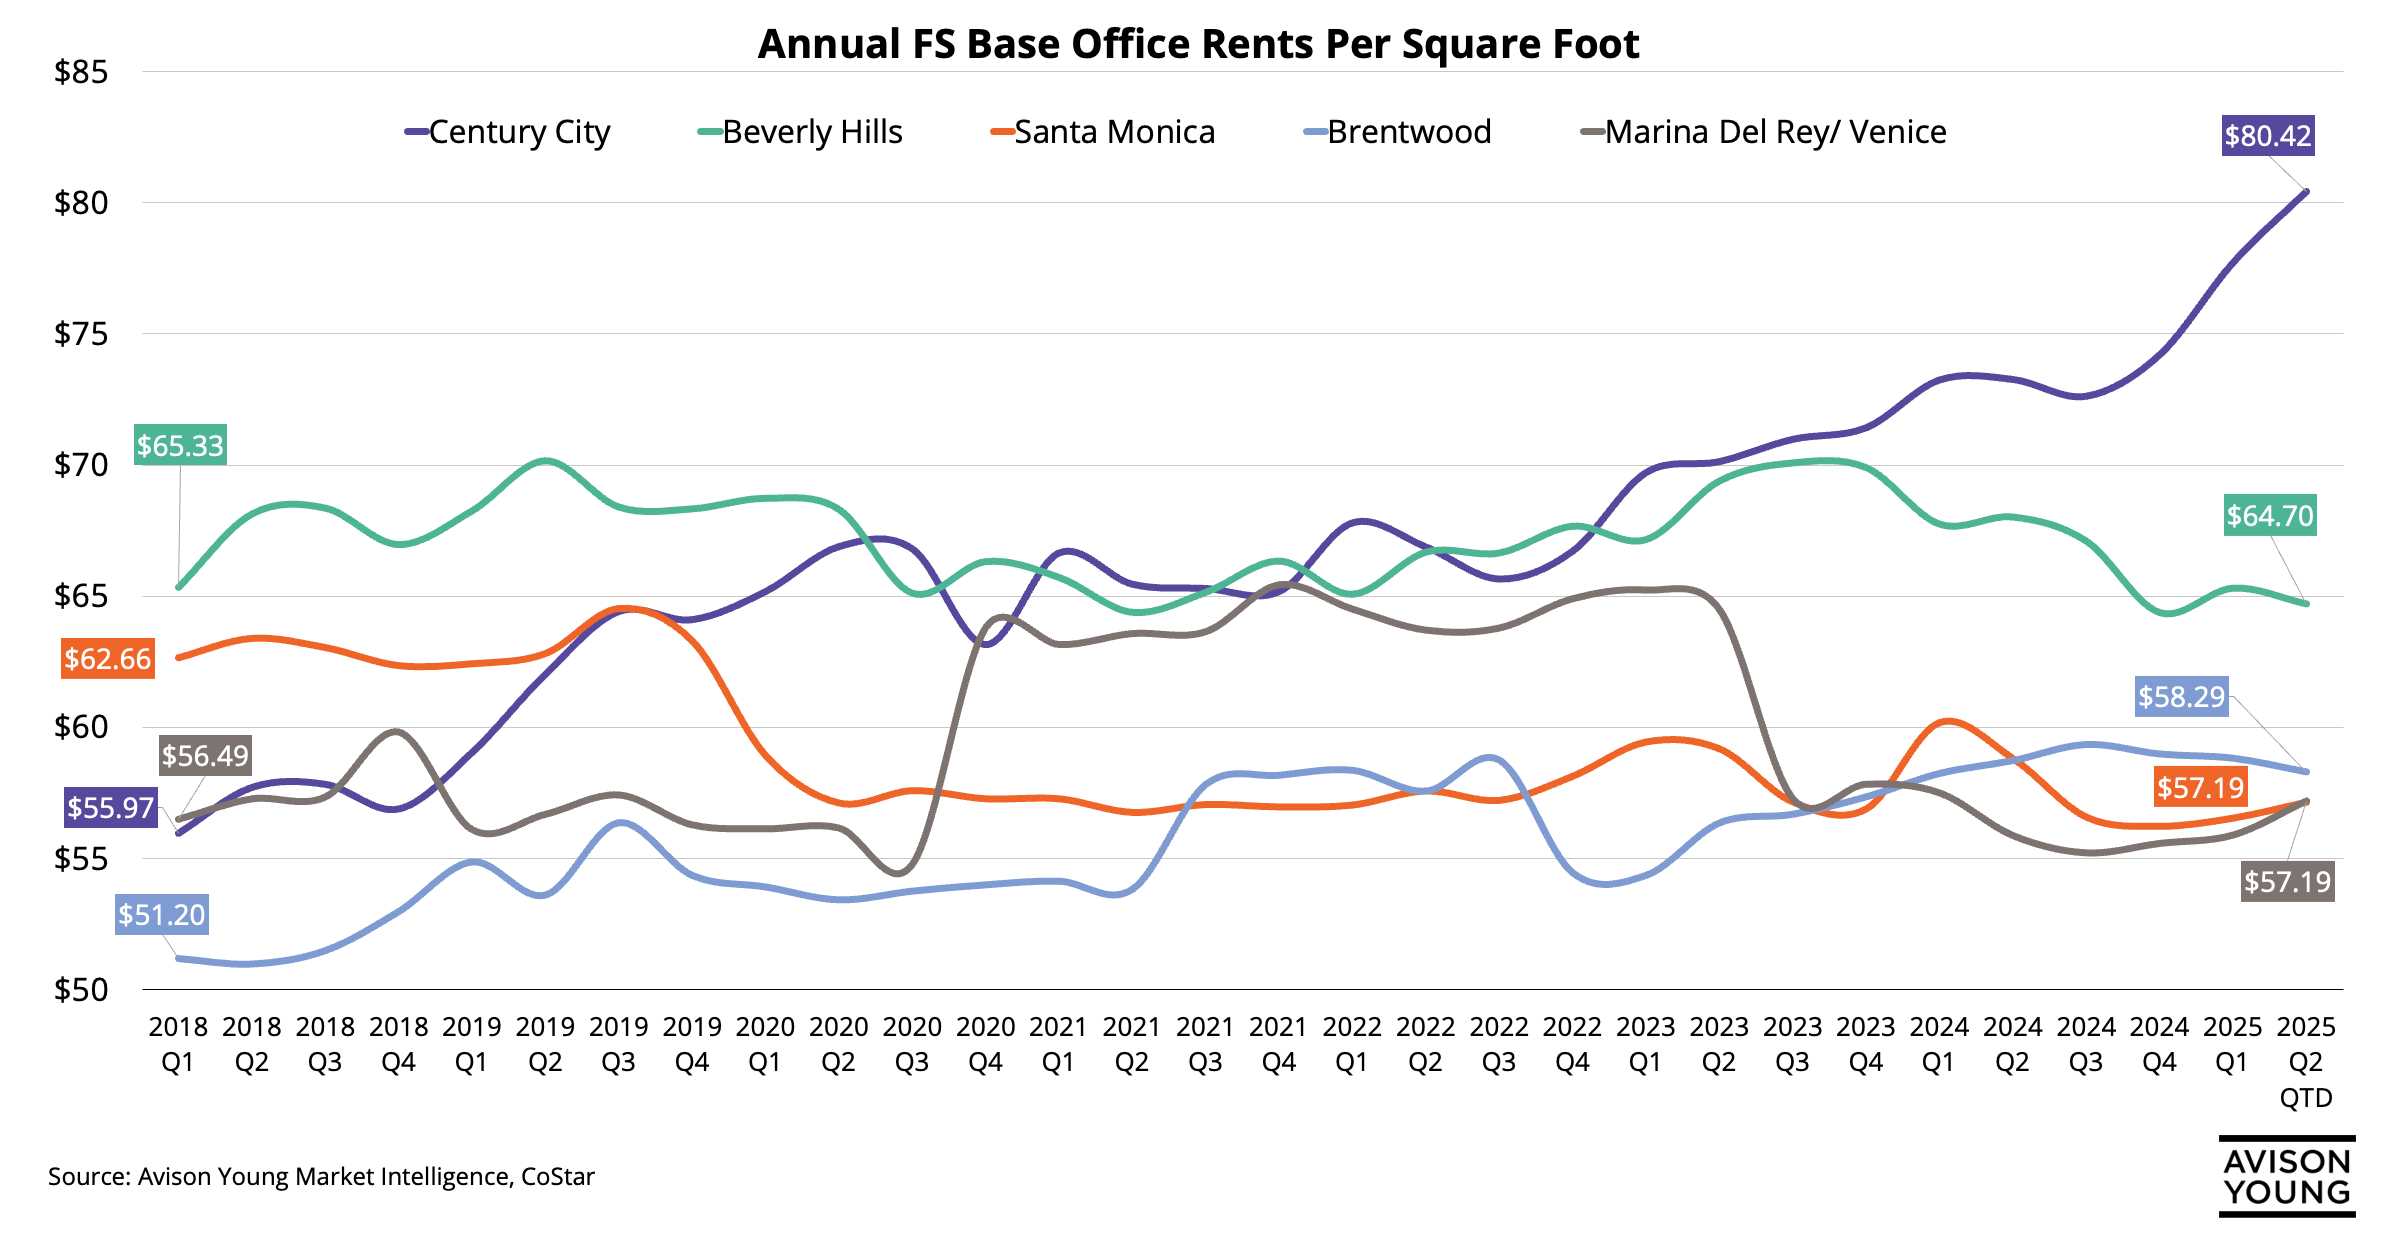 Century City tops Los Angeles office market with unmatched rental growth
 -
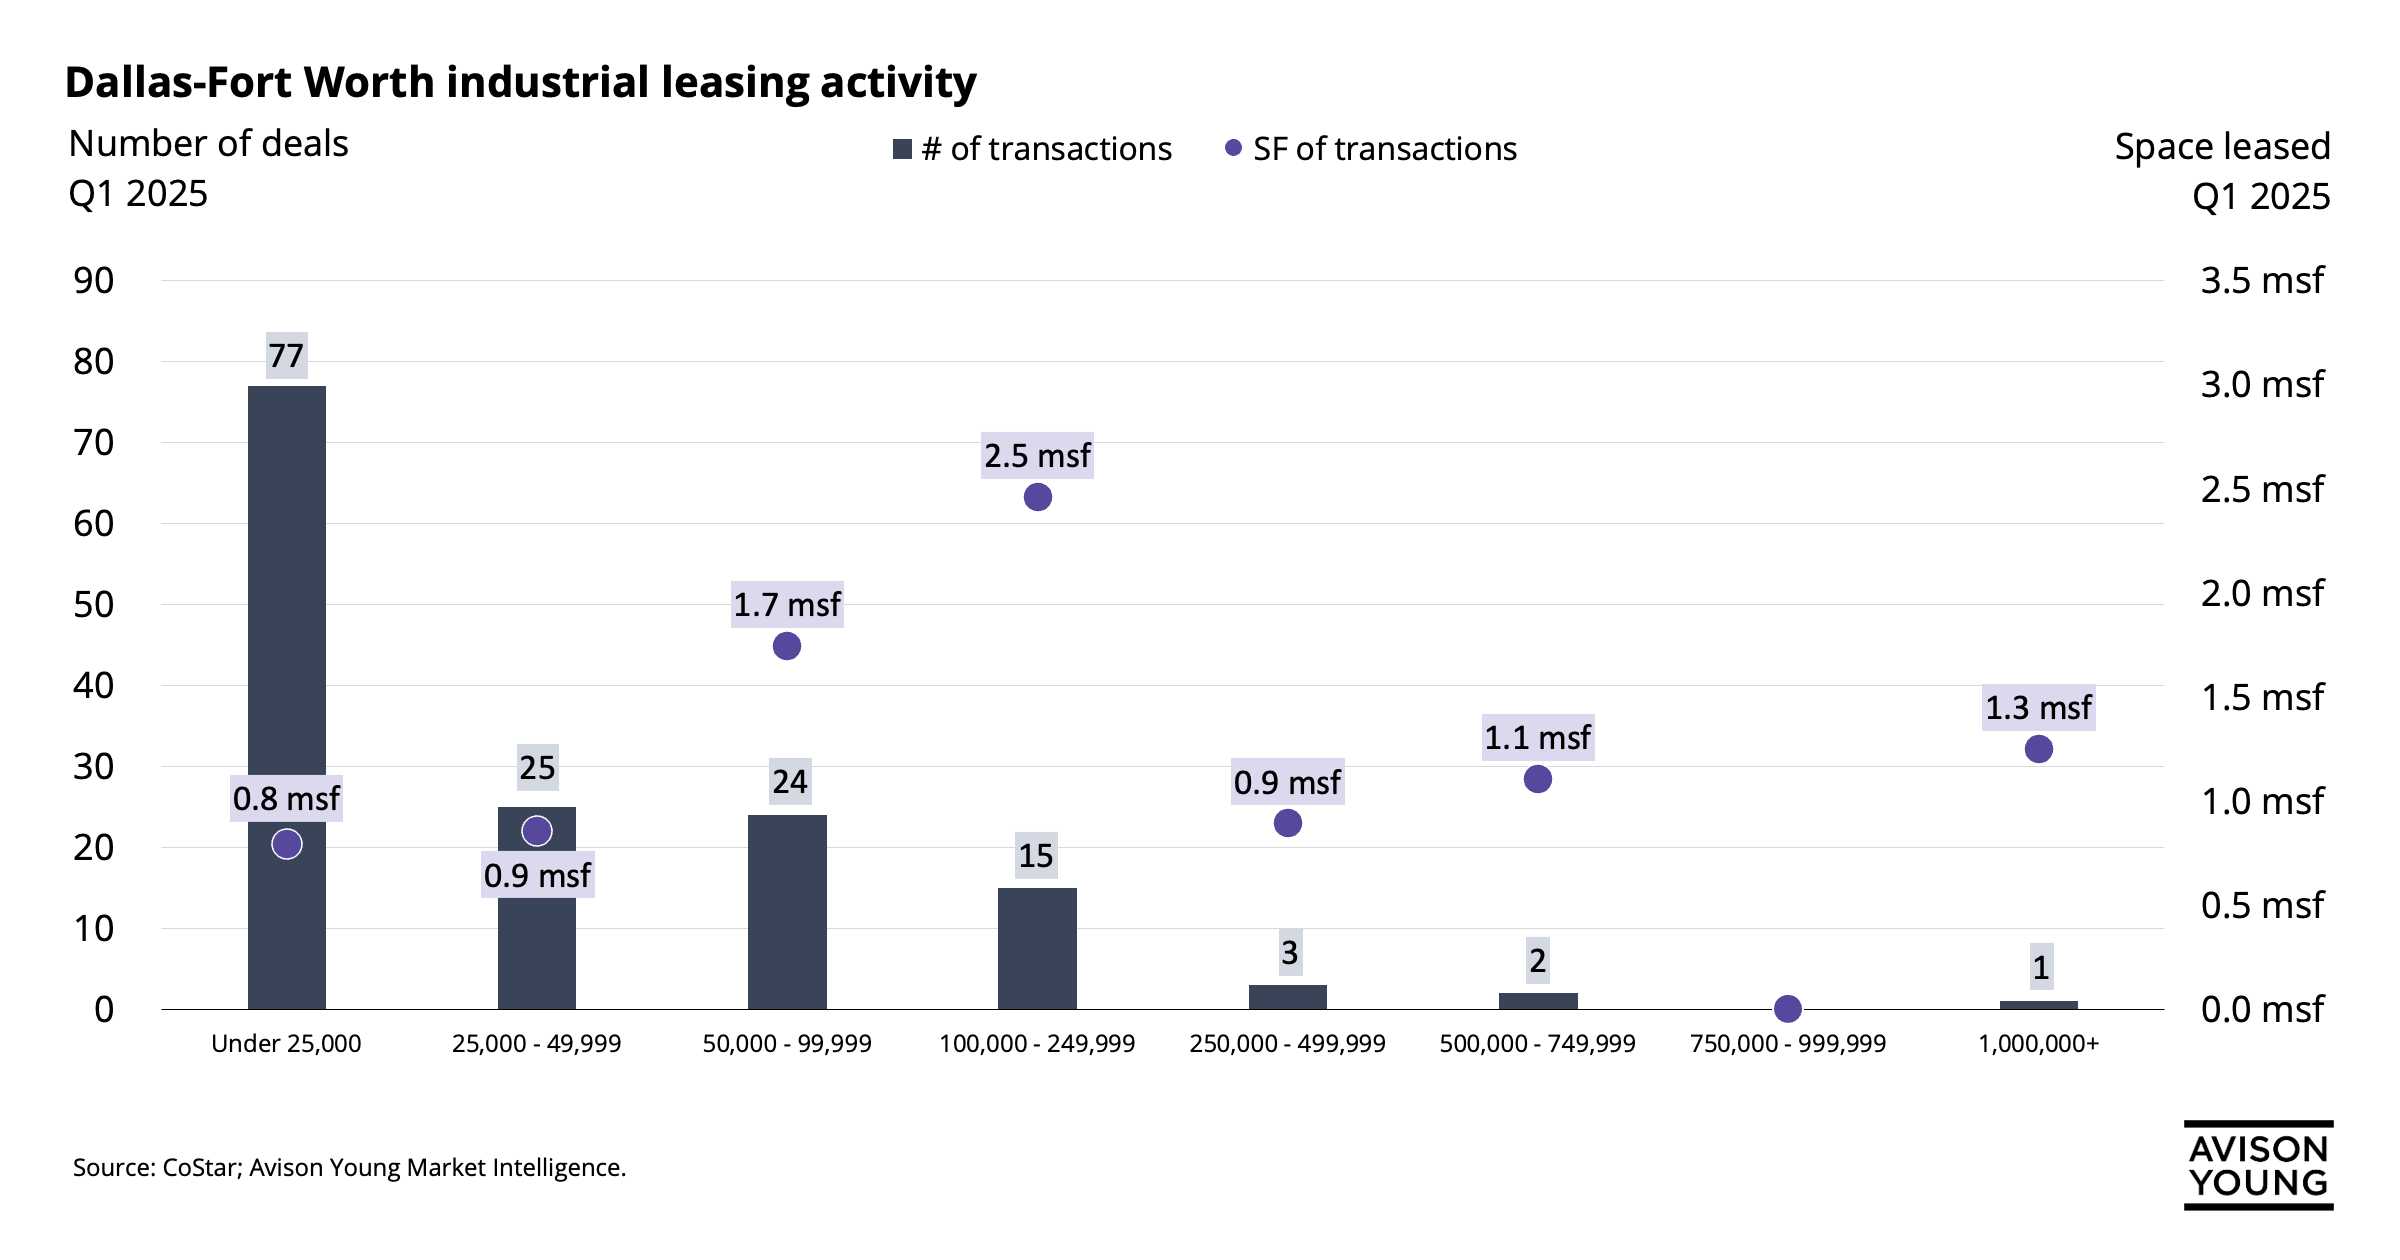 Medium to large industrial users are the “sweet spot” in the Dallas-Fort Worth industrial market
 -
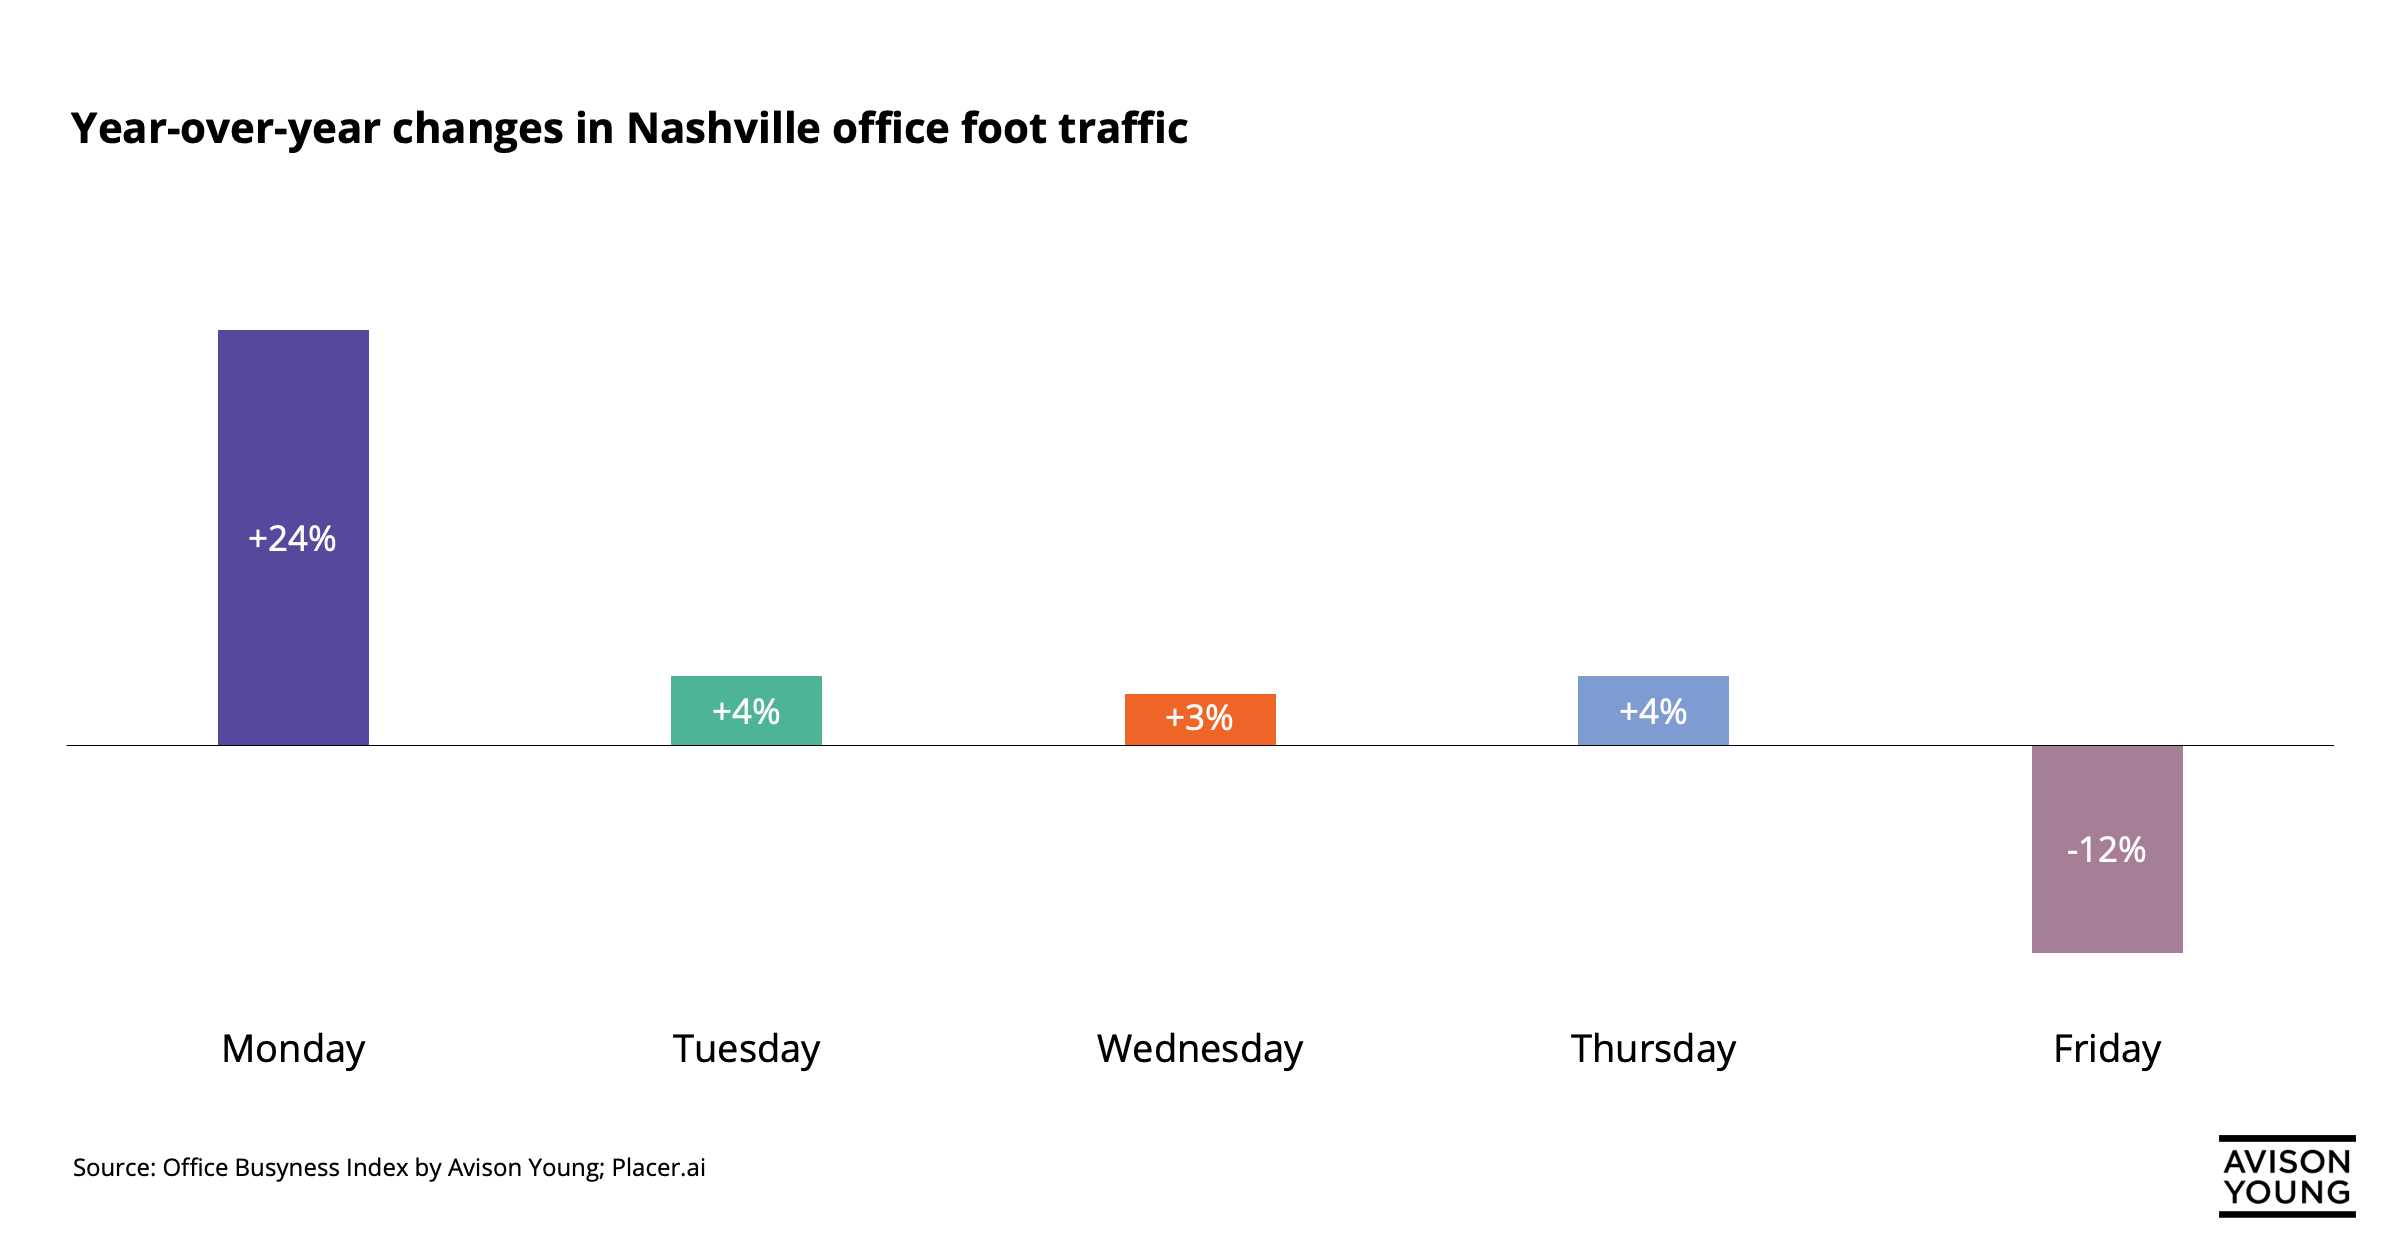 No case of the Mondays for Nashville’s return-to-office
 -
 Sublease supply shrinks in NoVA’s top office hubs amid post-COVID stabilization
 -
 Small space users remain active amidst low MSP leasing activity
 -
 - Read-Only.png/c92ee327-6d11-9b78-a4c2-11594649c3a9?t=1747923465942) Boston industrial subtypes react differently to economic shifts
Boston industrial subtypes react differently to economic shifts -
 From expansion to equilibrium: Orlando industrial positions for sustainable growth
 -
 Tampa Bay industrial availability is shaped heavily by submarket
 -
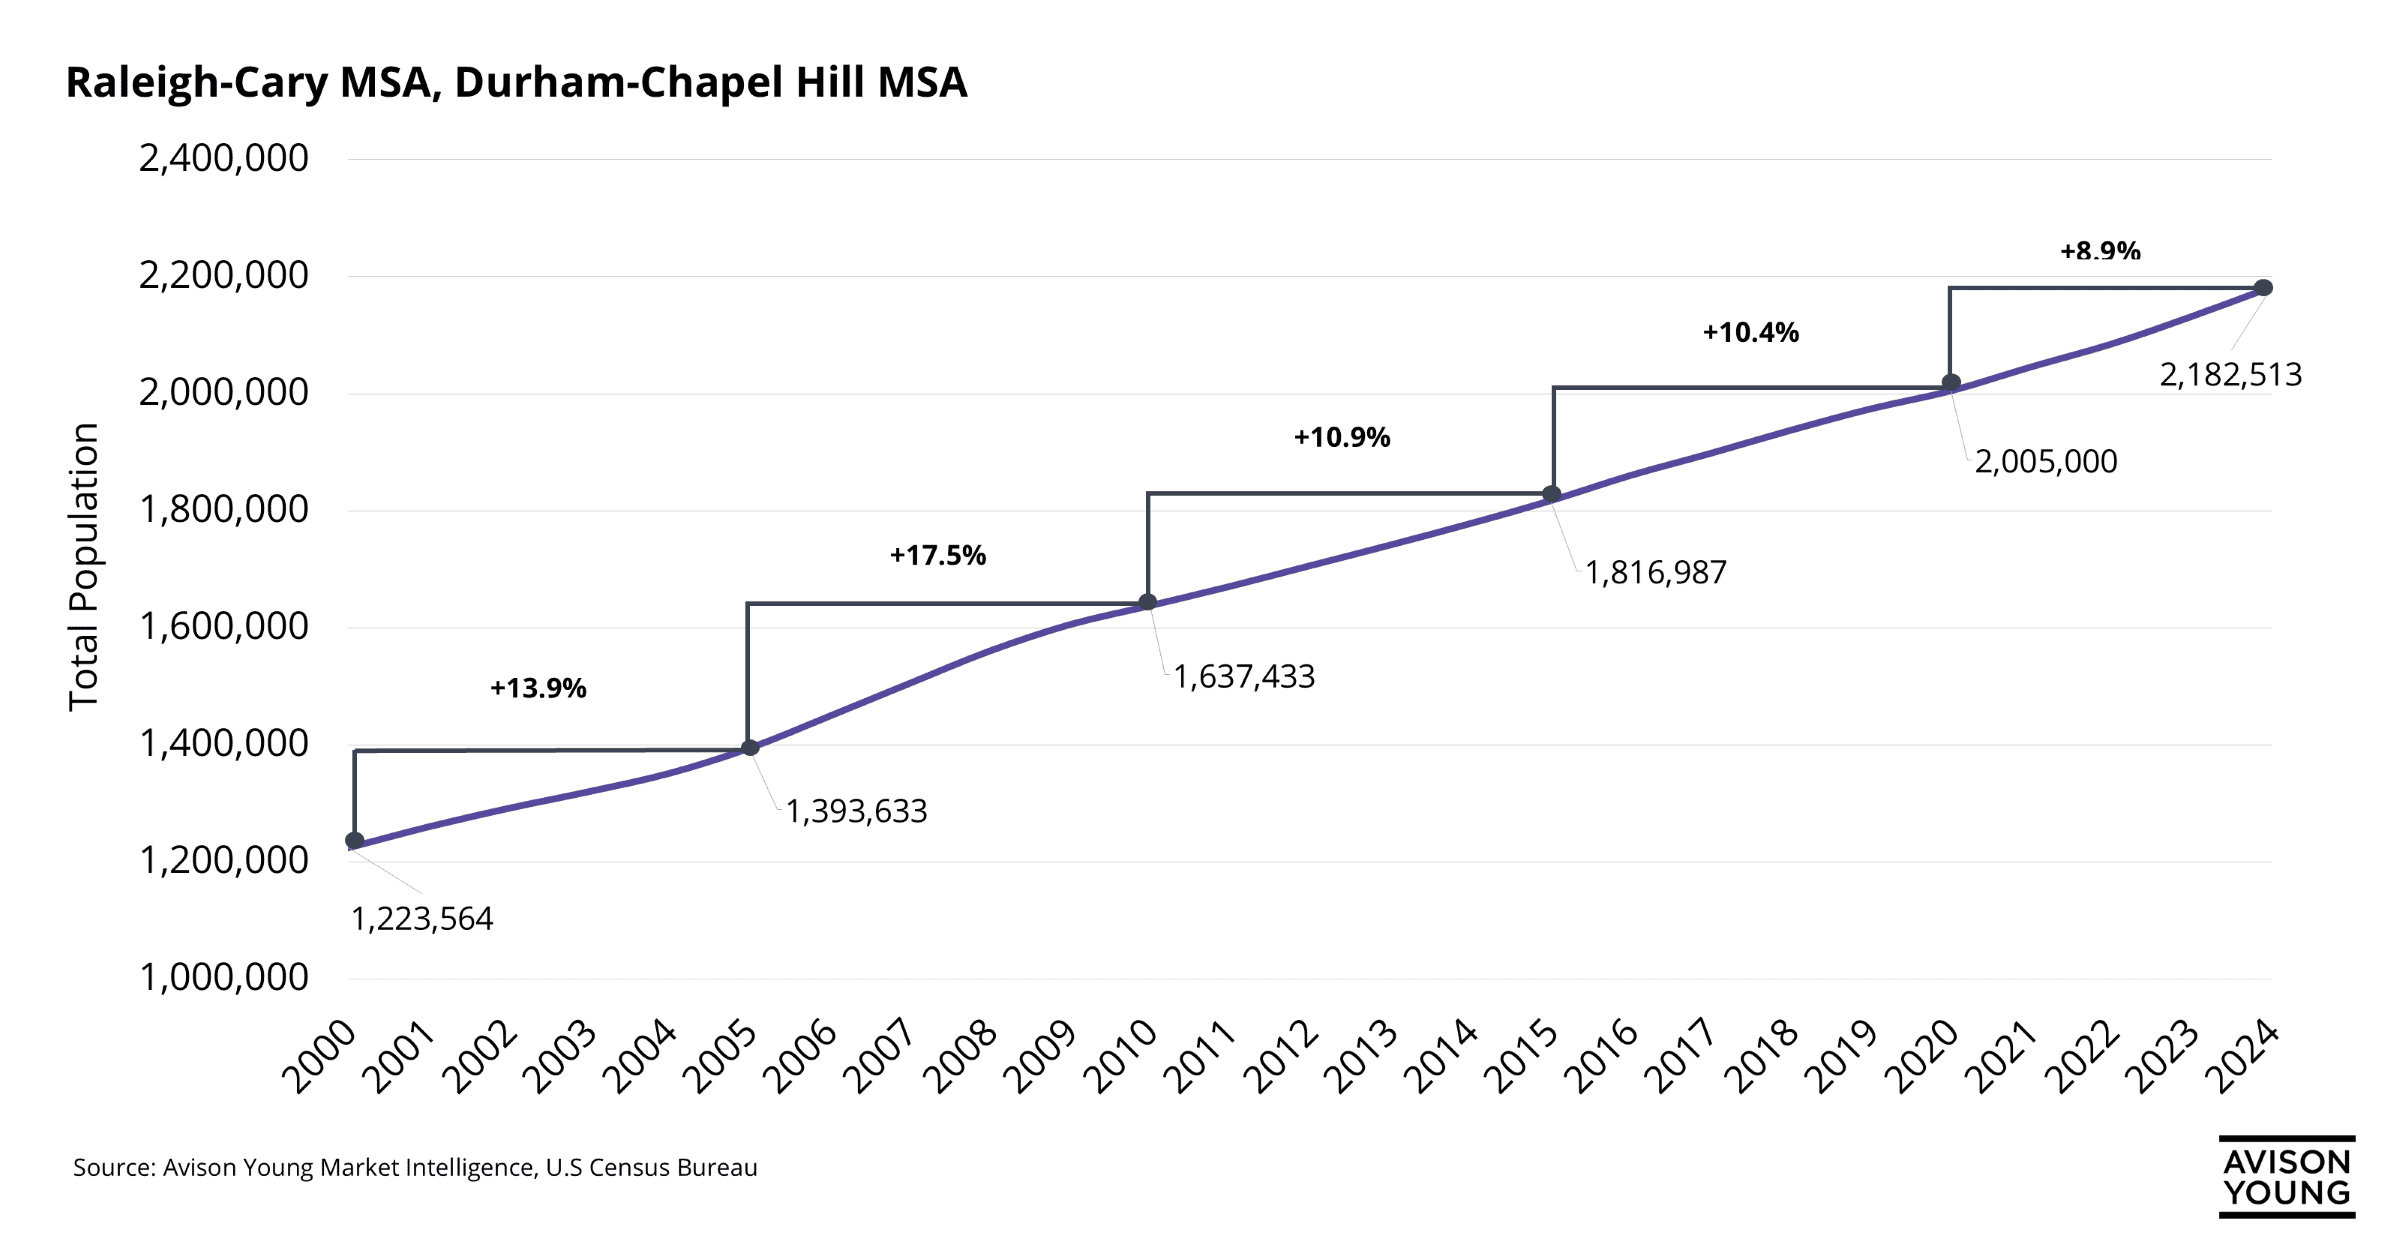 How Raleigh-Durham is defying national trends with robust growth
 -
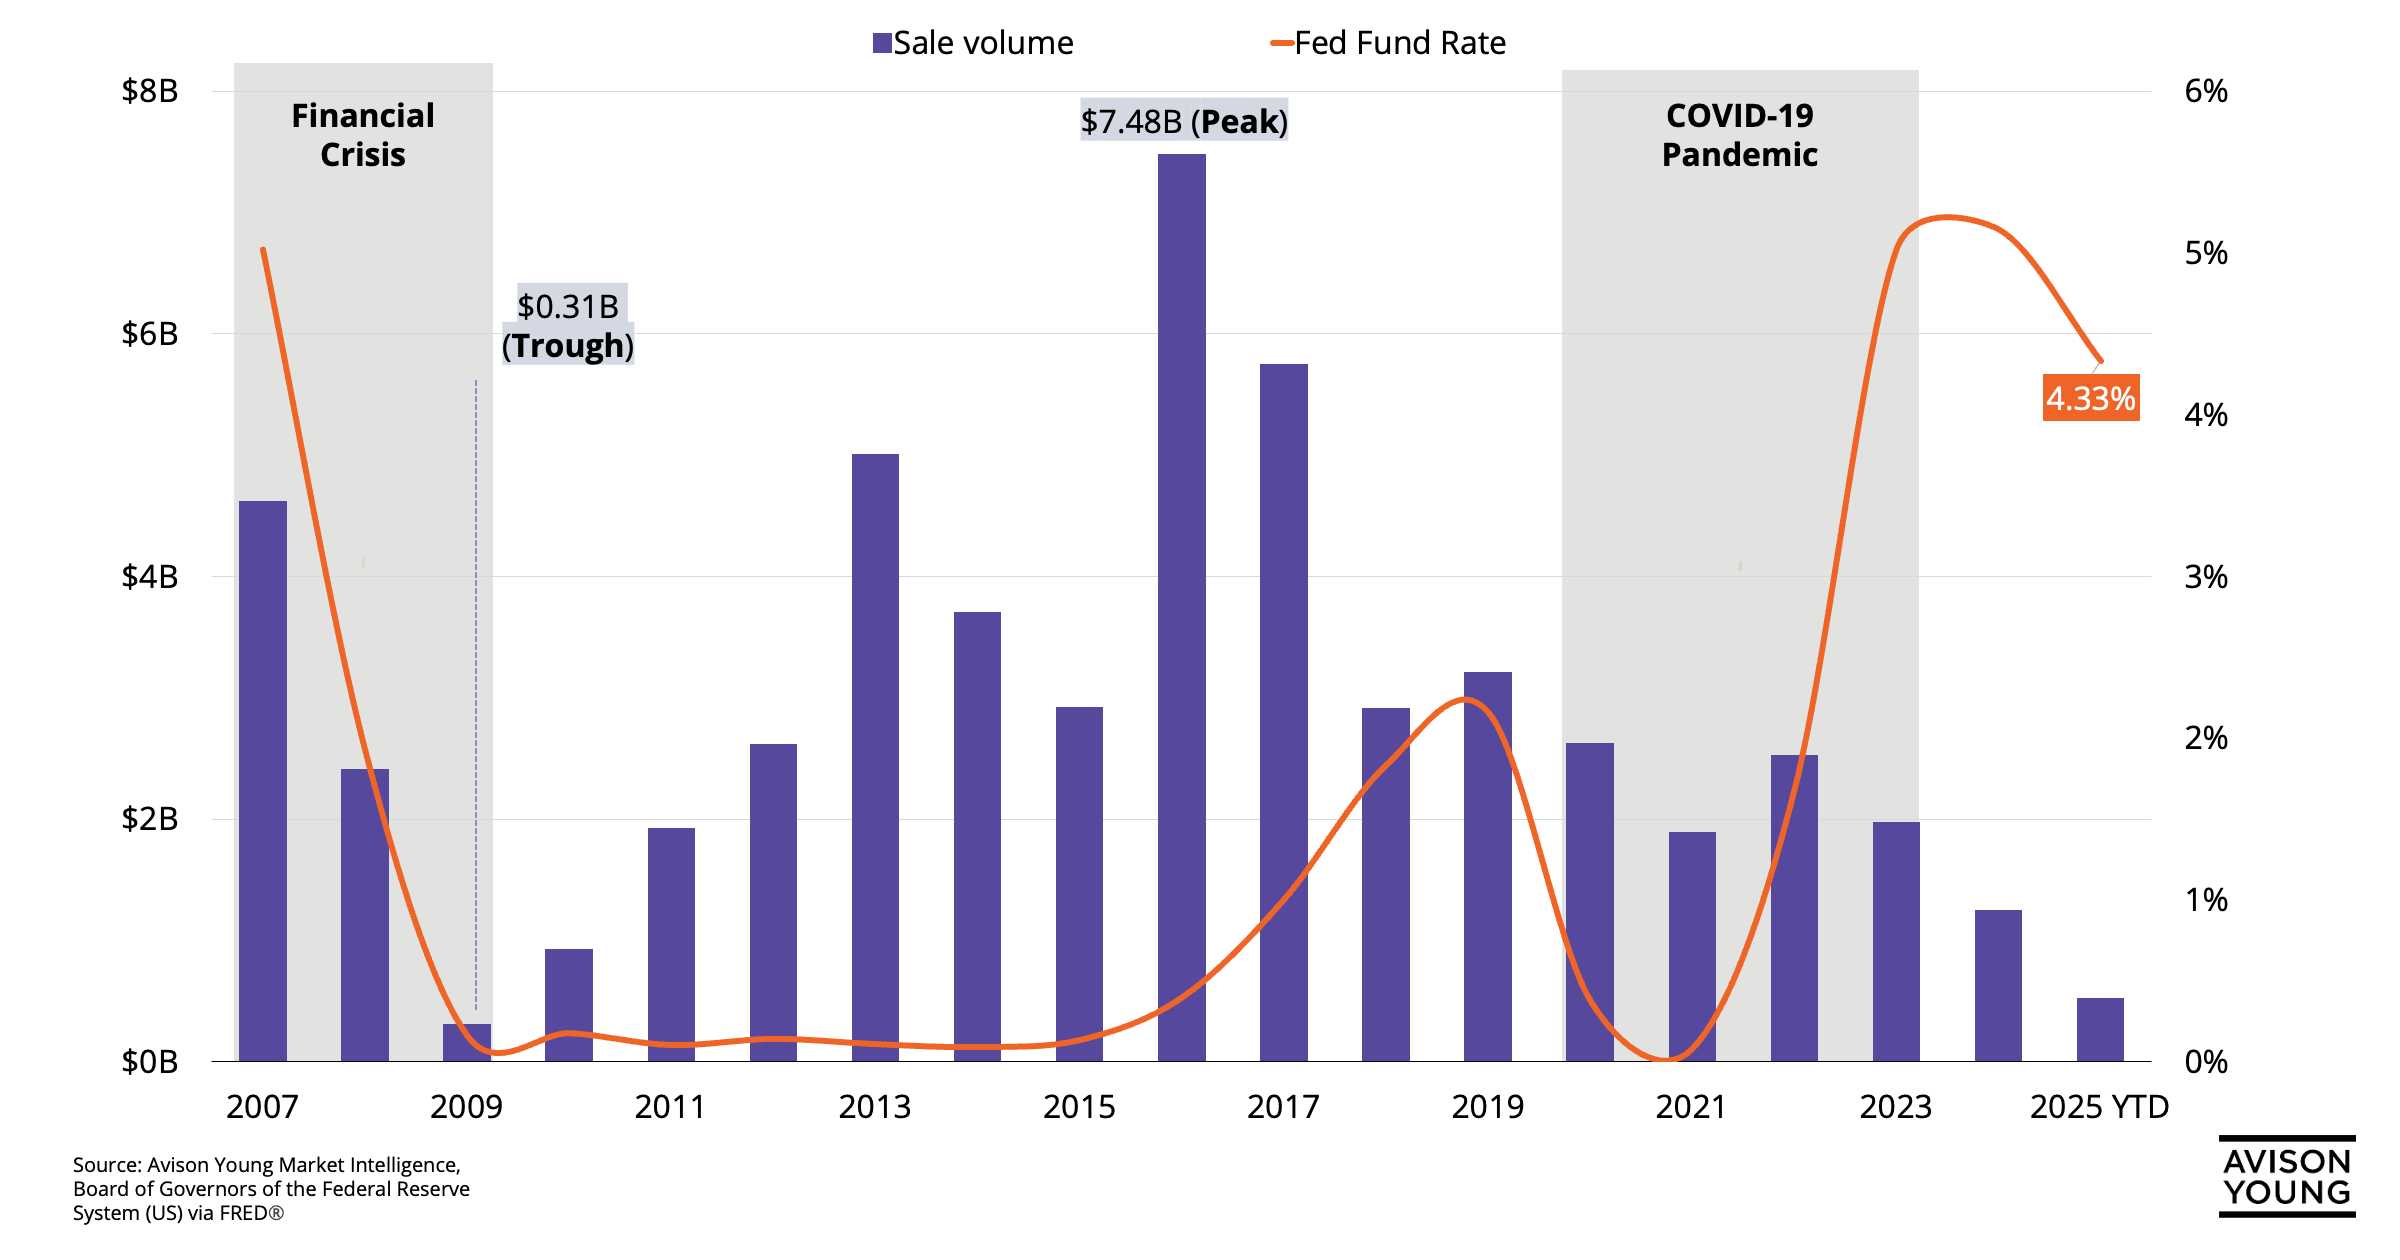 LA office investment sales: A market shaped by shifting tides
 -
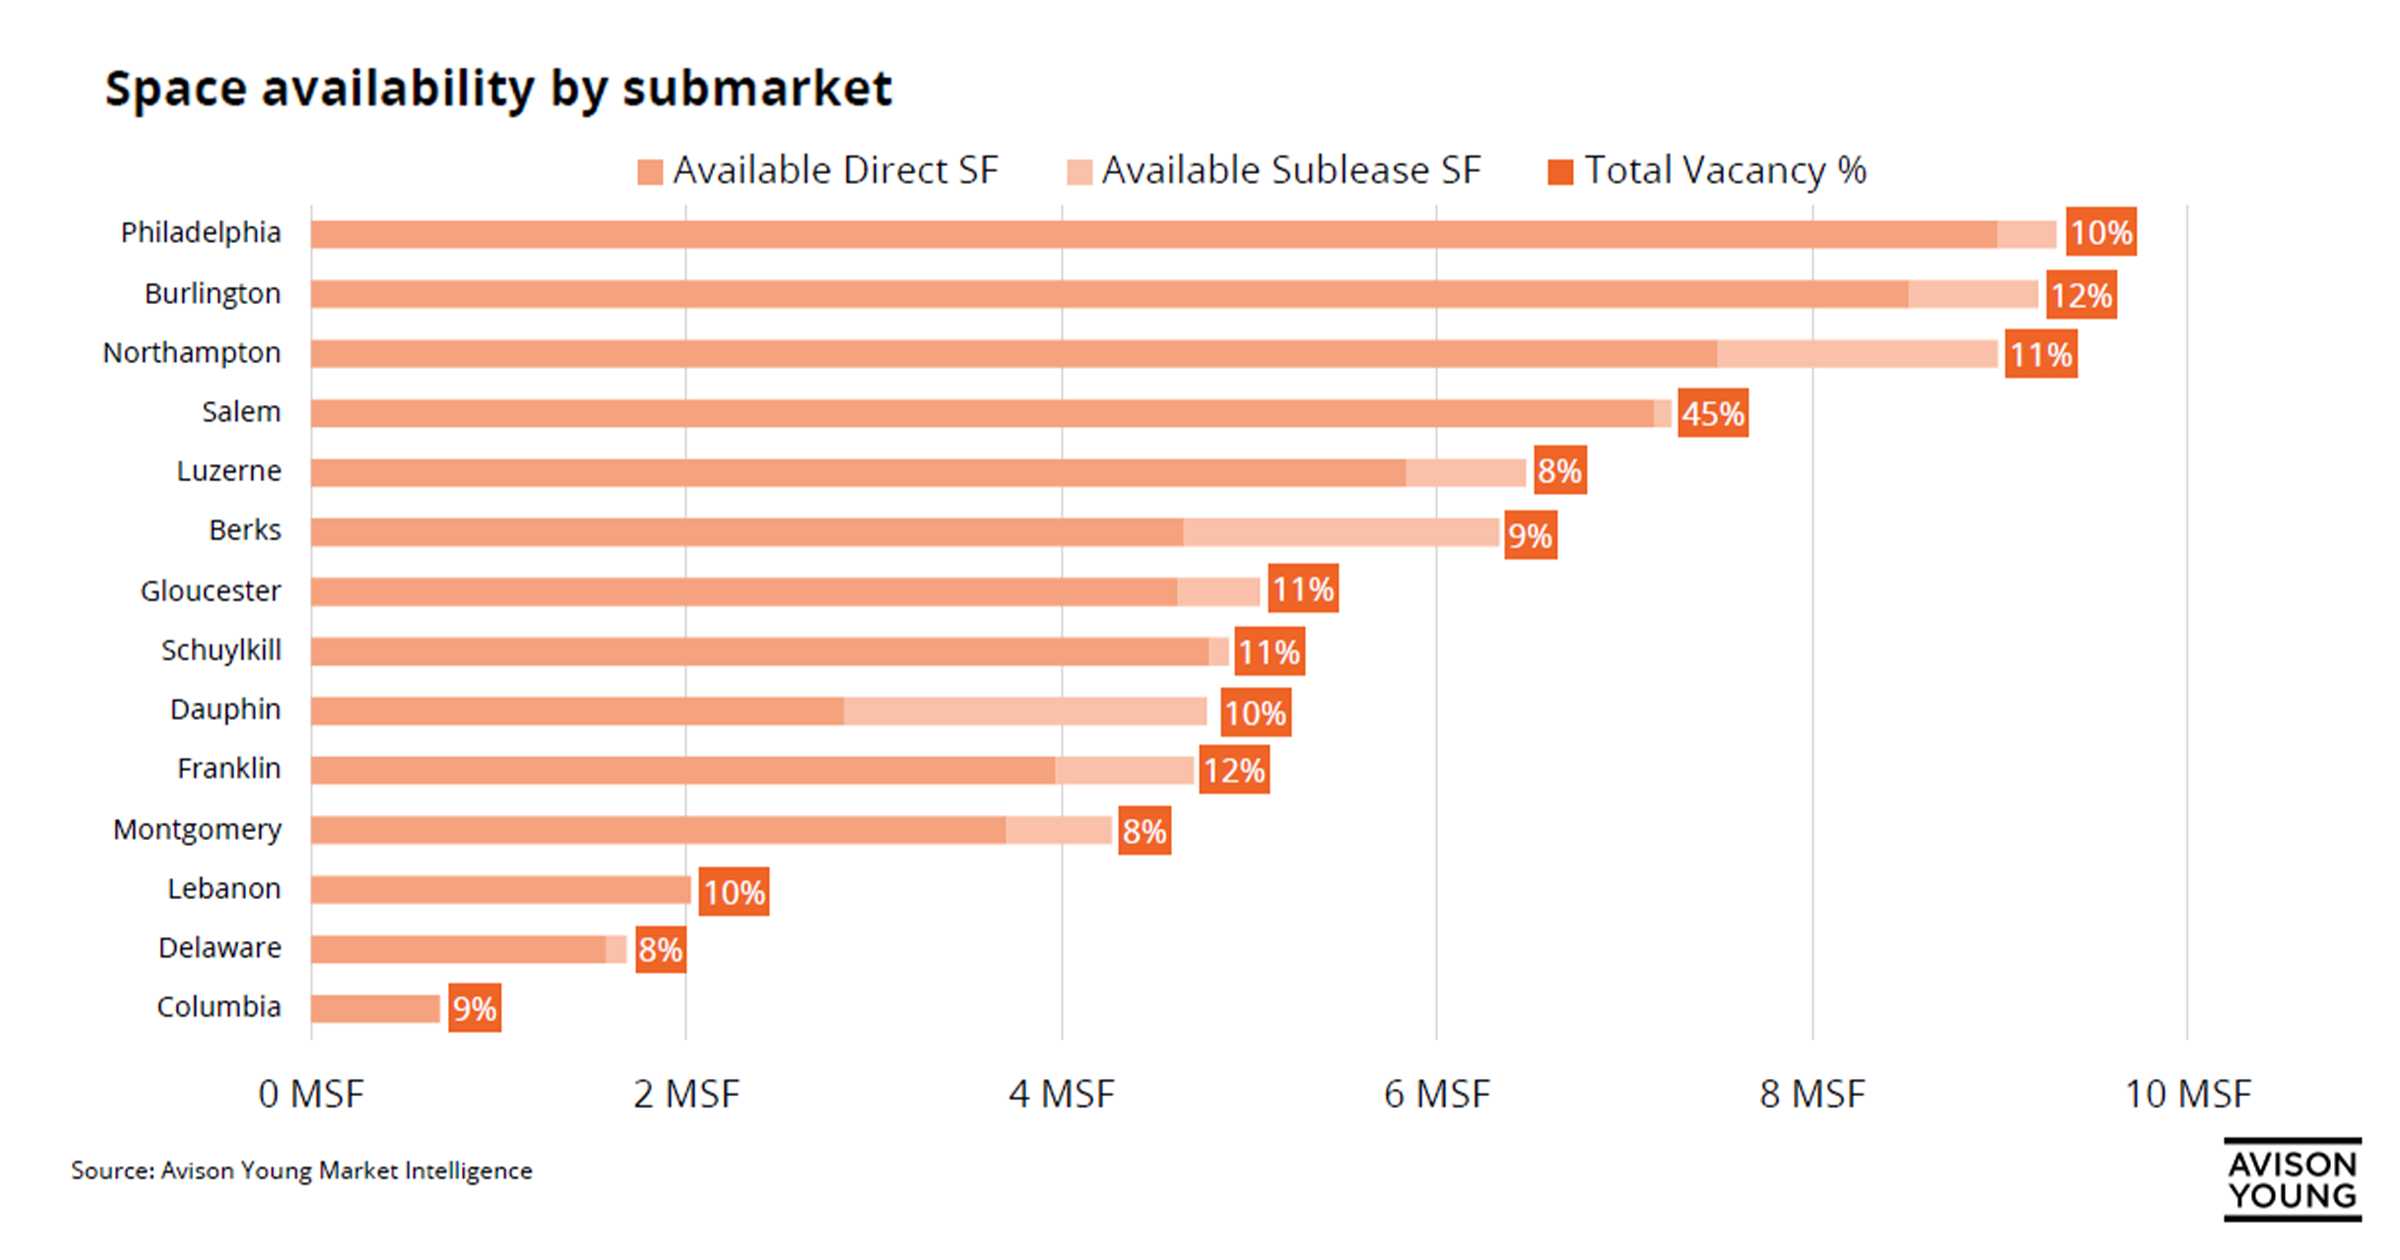
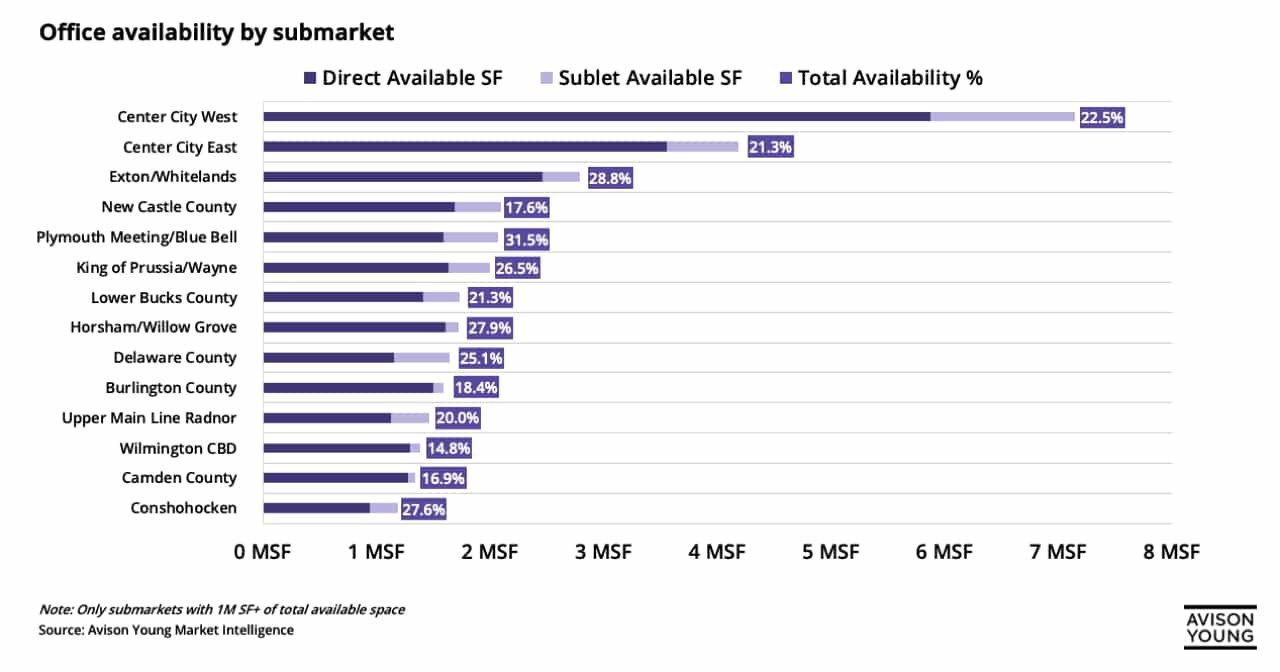 Submarket availability has yet to reach equilibrium across the Greater Philadelphia office market
 -
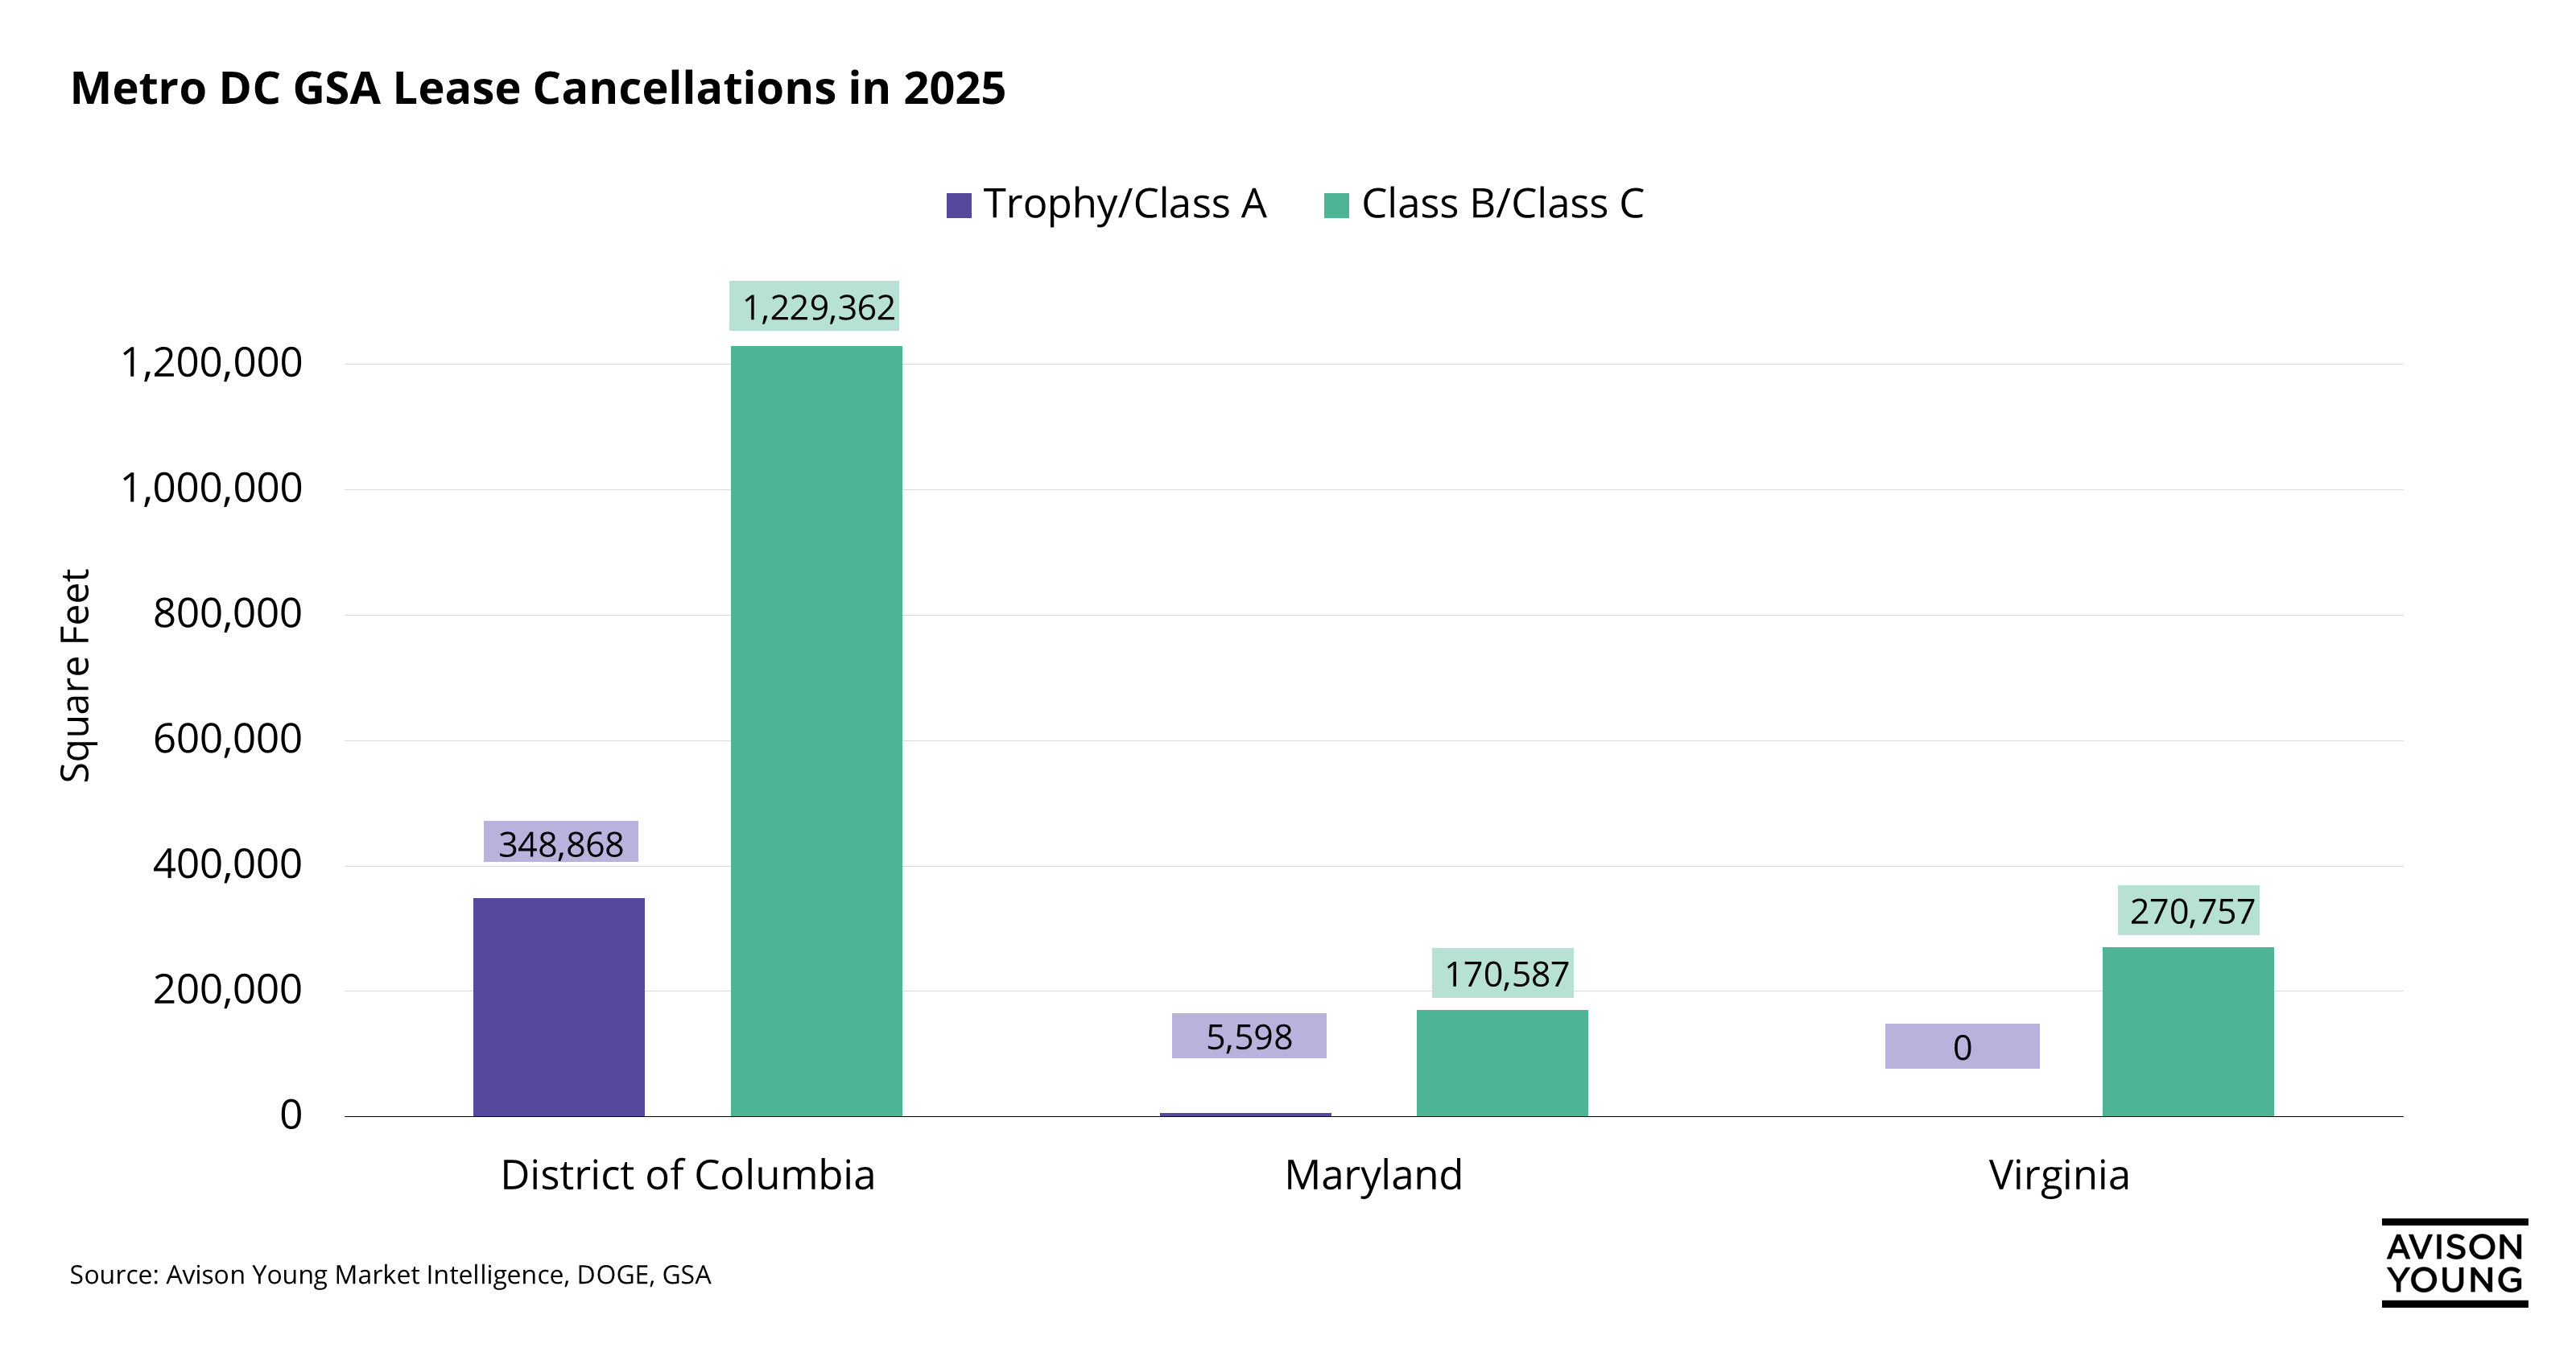 GSA lease cancellations drive further wedge between top and bottom quality of the DC, Maryland, and Virginia office market
 -
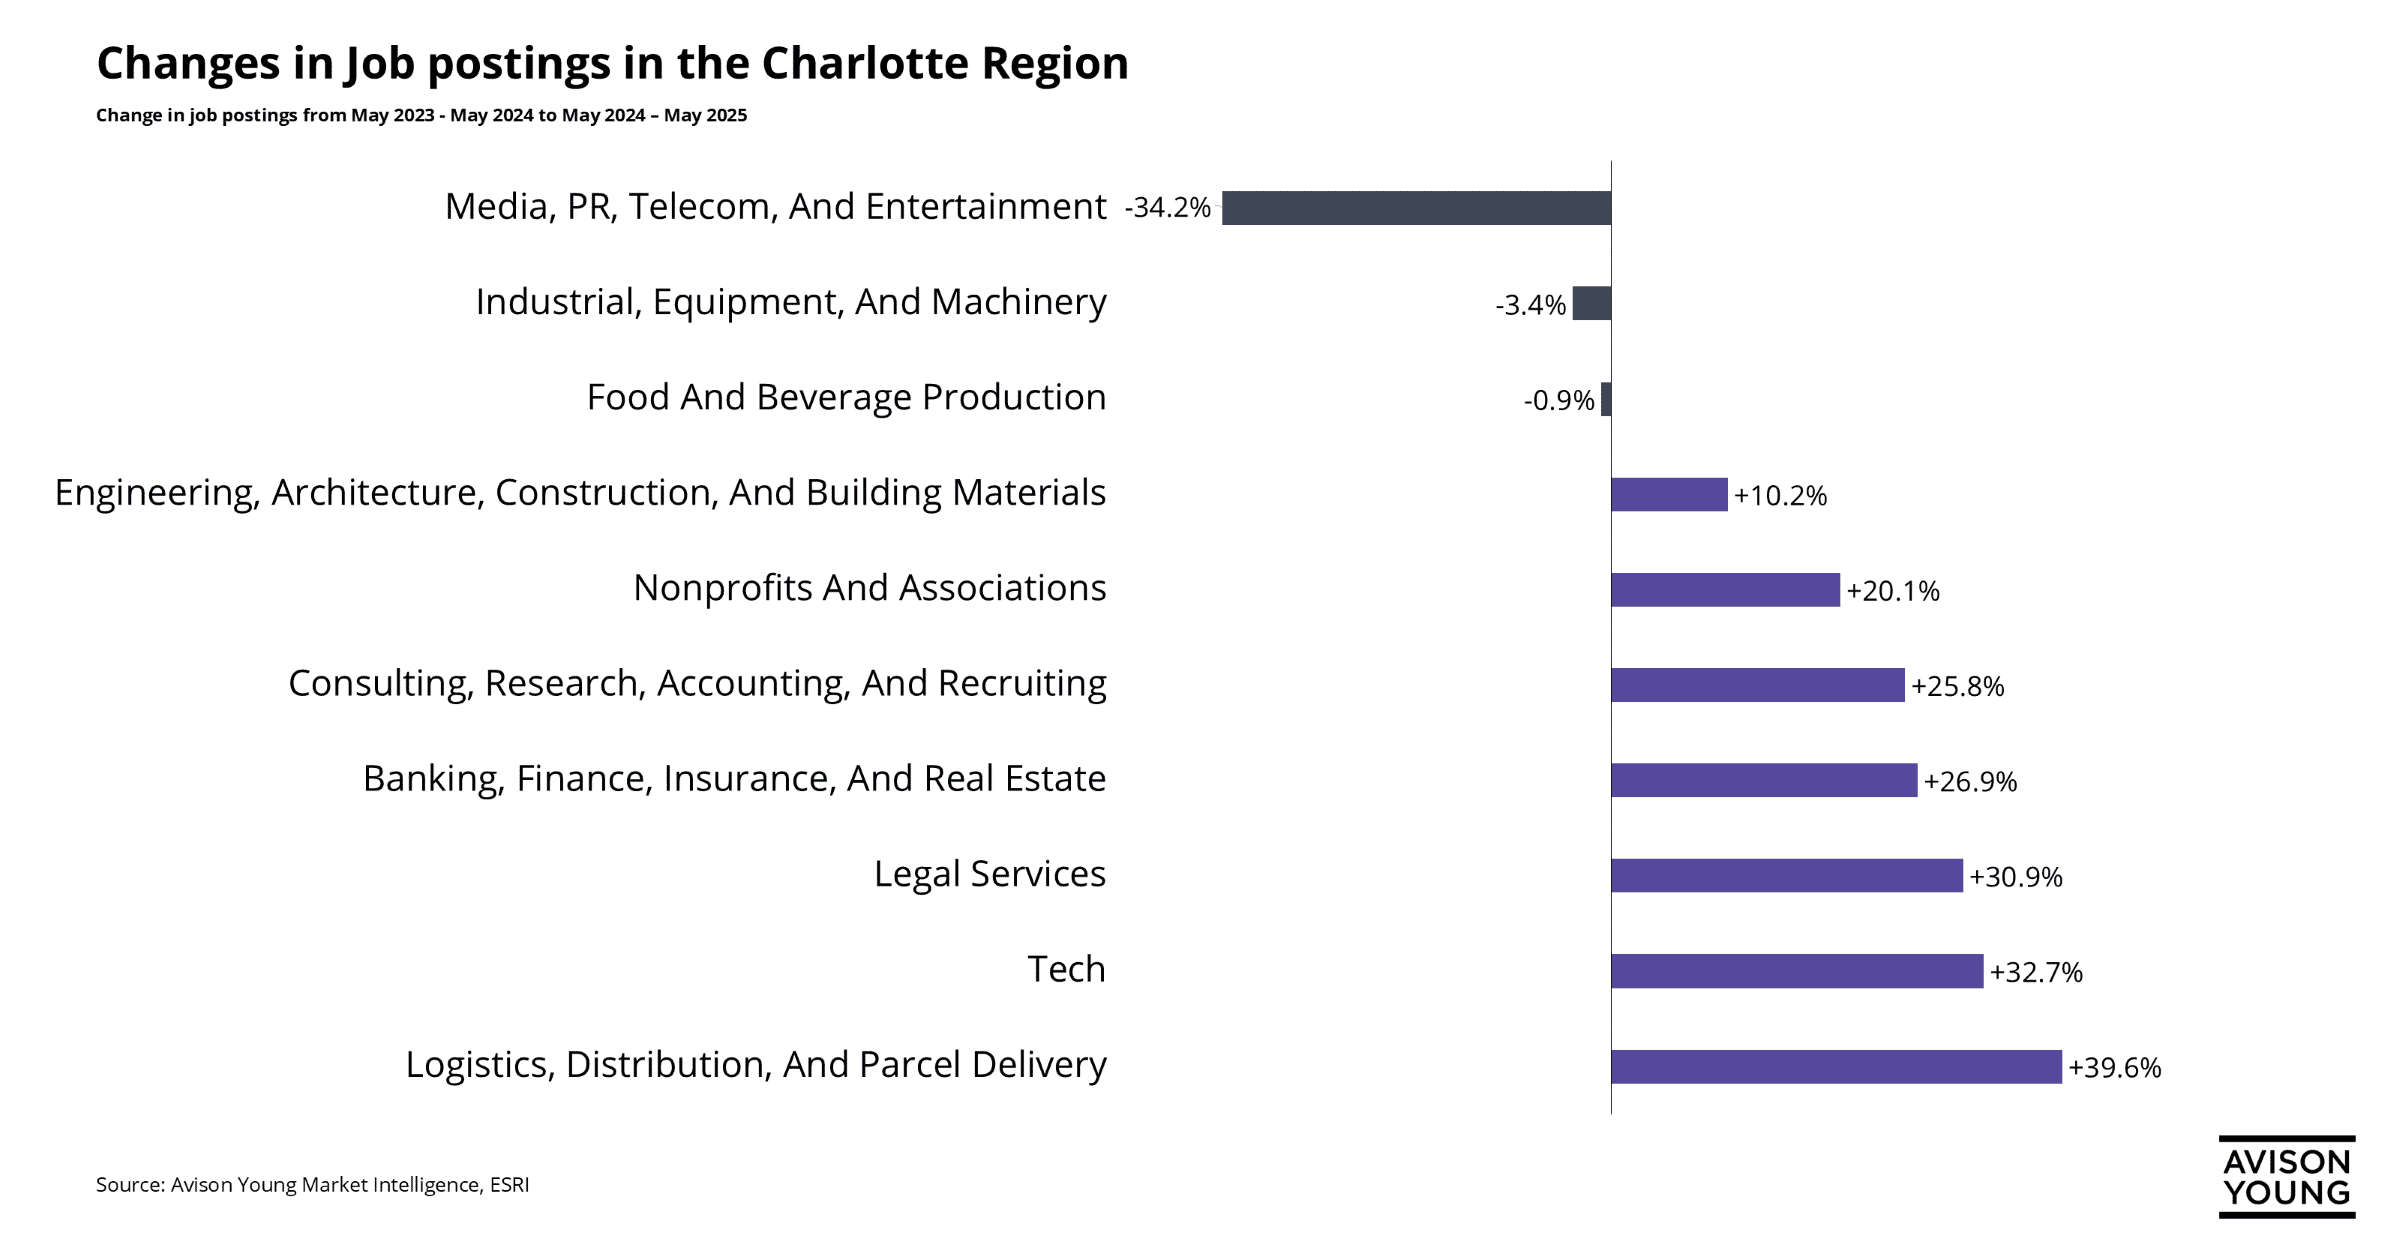 Why are job postings in Charlotte seeing significant shifts heading into 2025?
 -
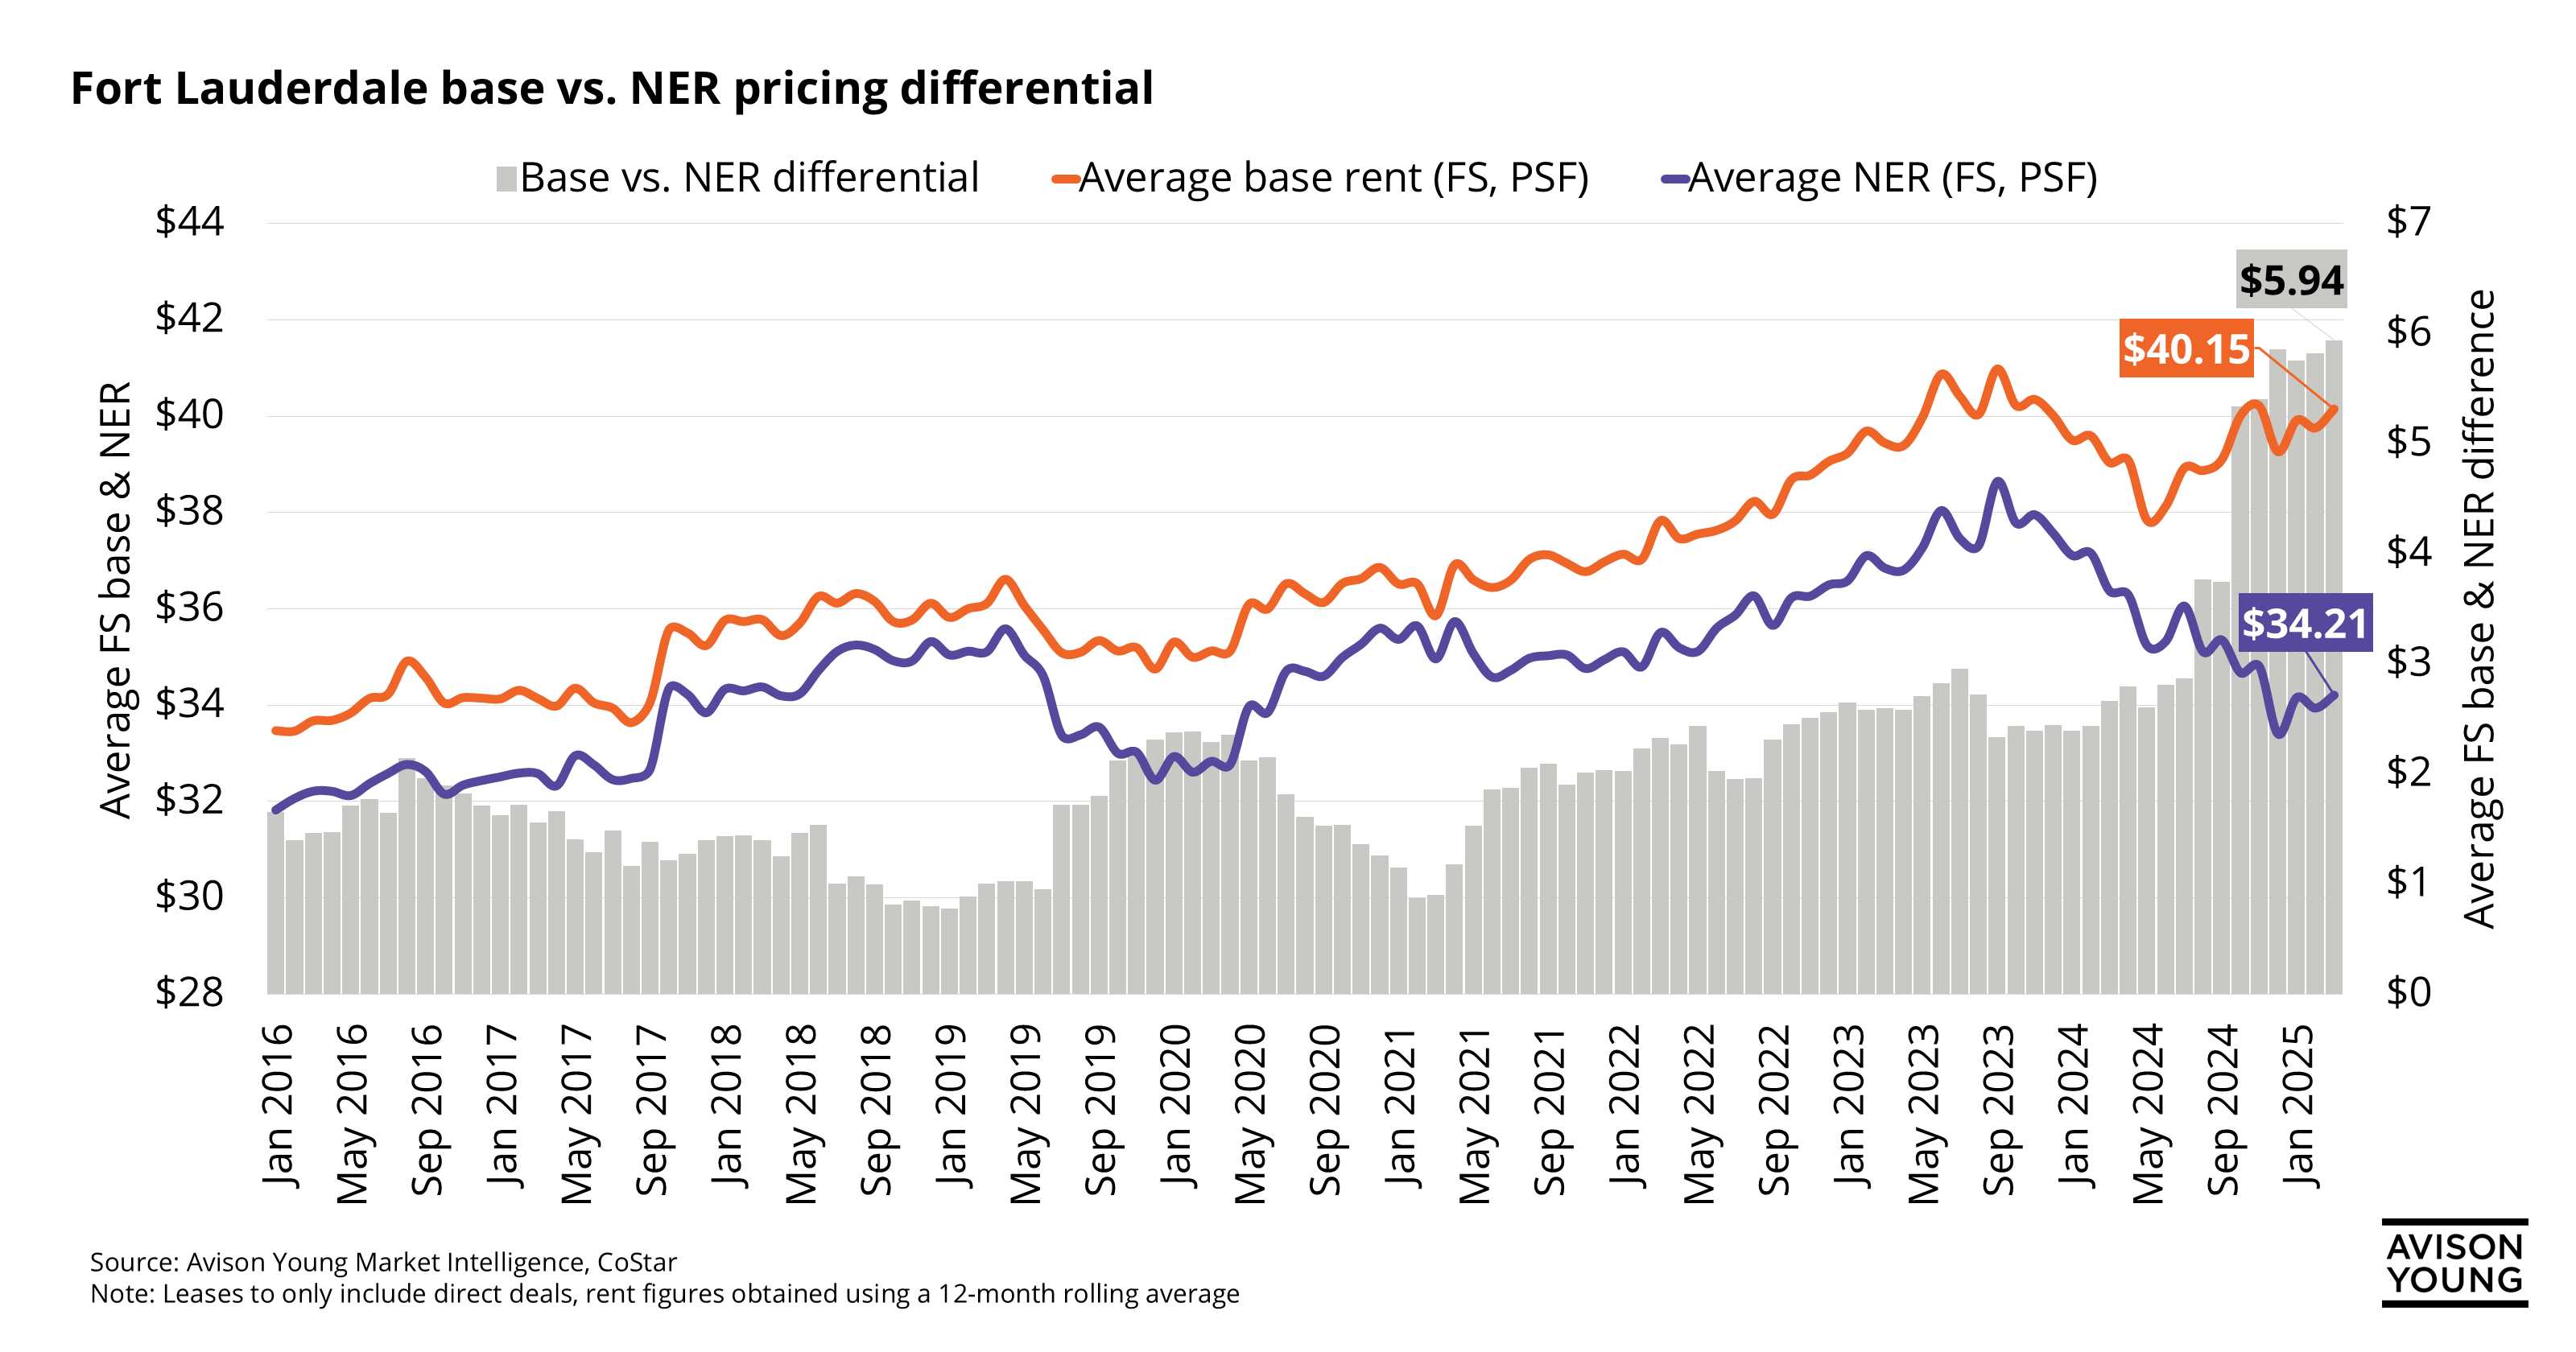 Fort Lauderdale base vs. NER pricing difference sees significant growth in the past 12 months
 -
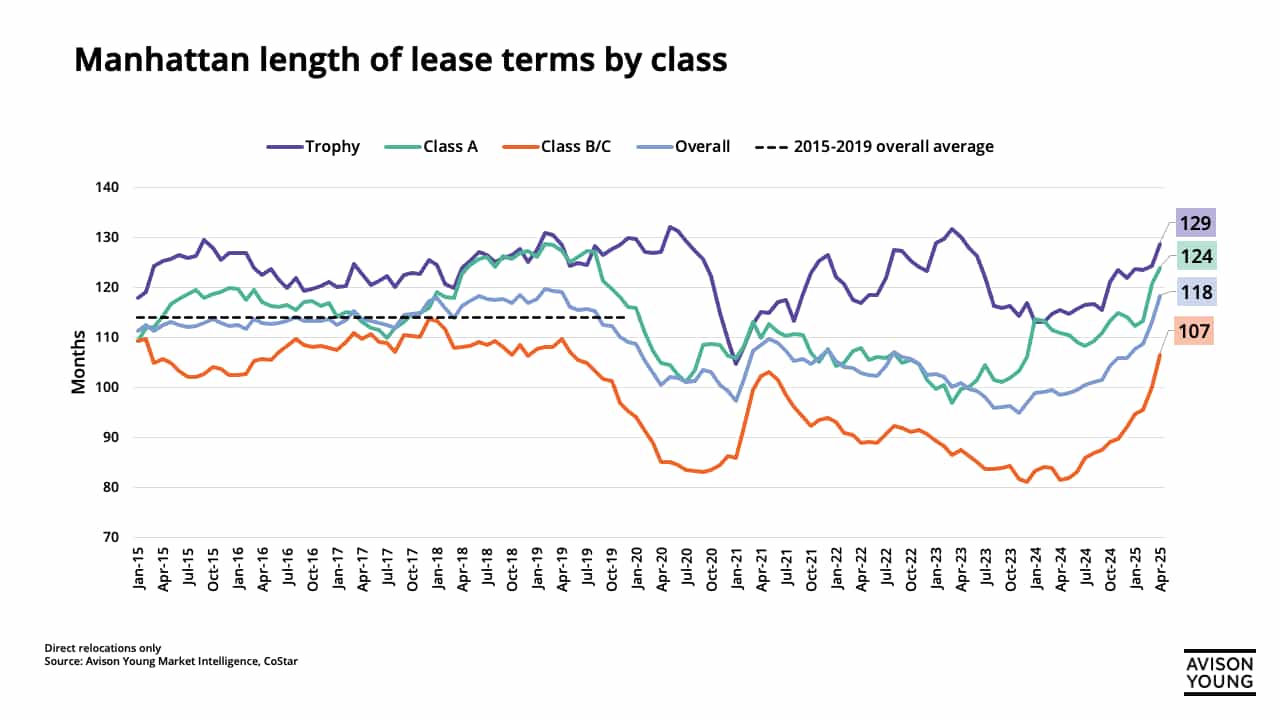 Manhattan lease terms surpass pre-pandemic averages
 -
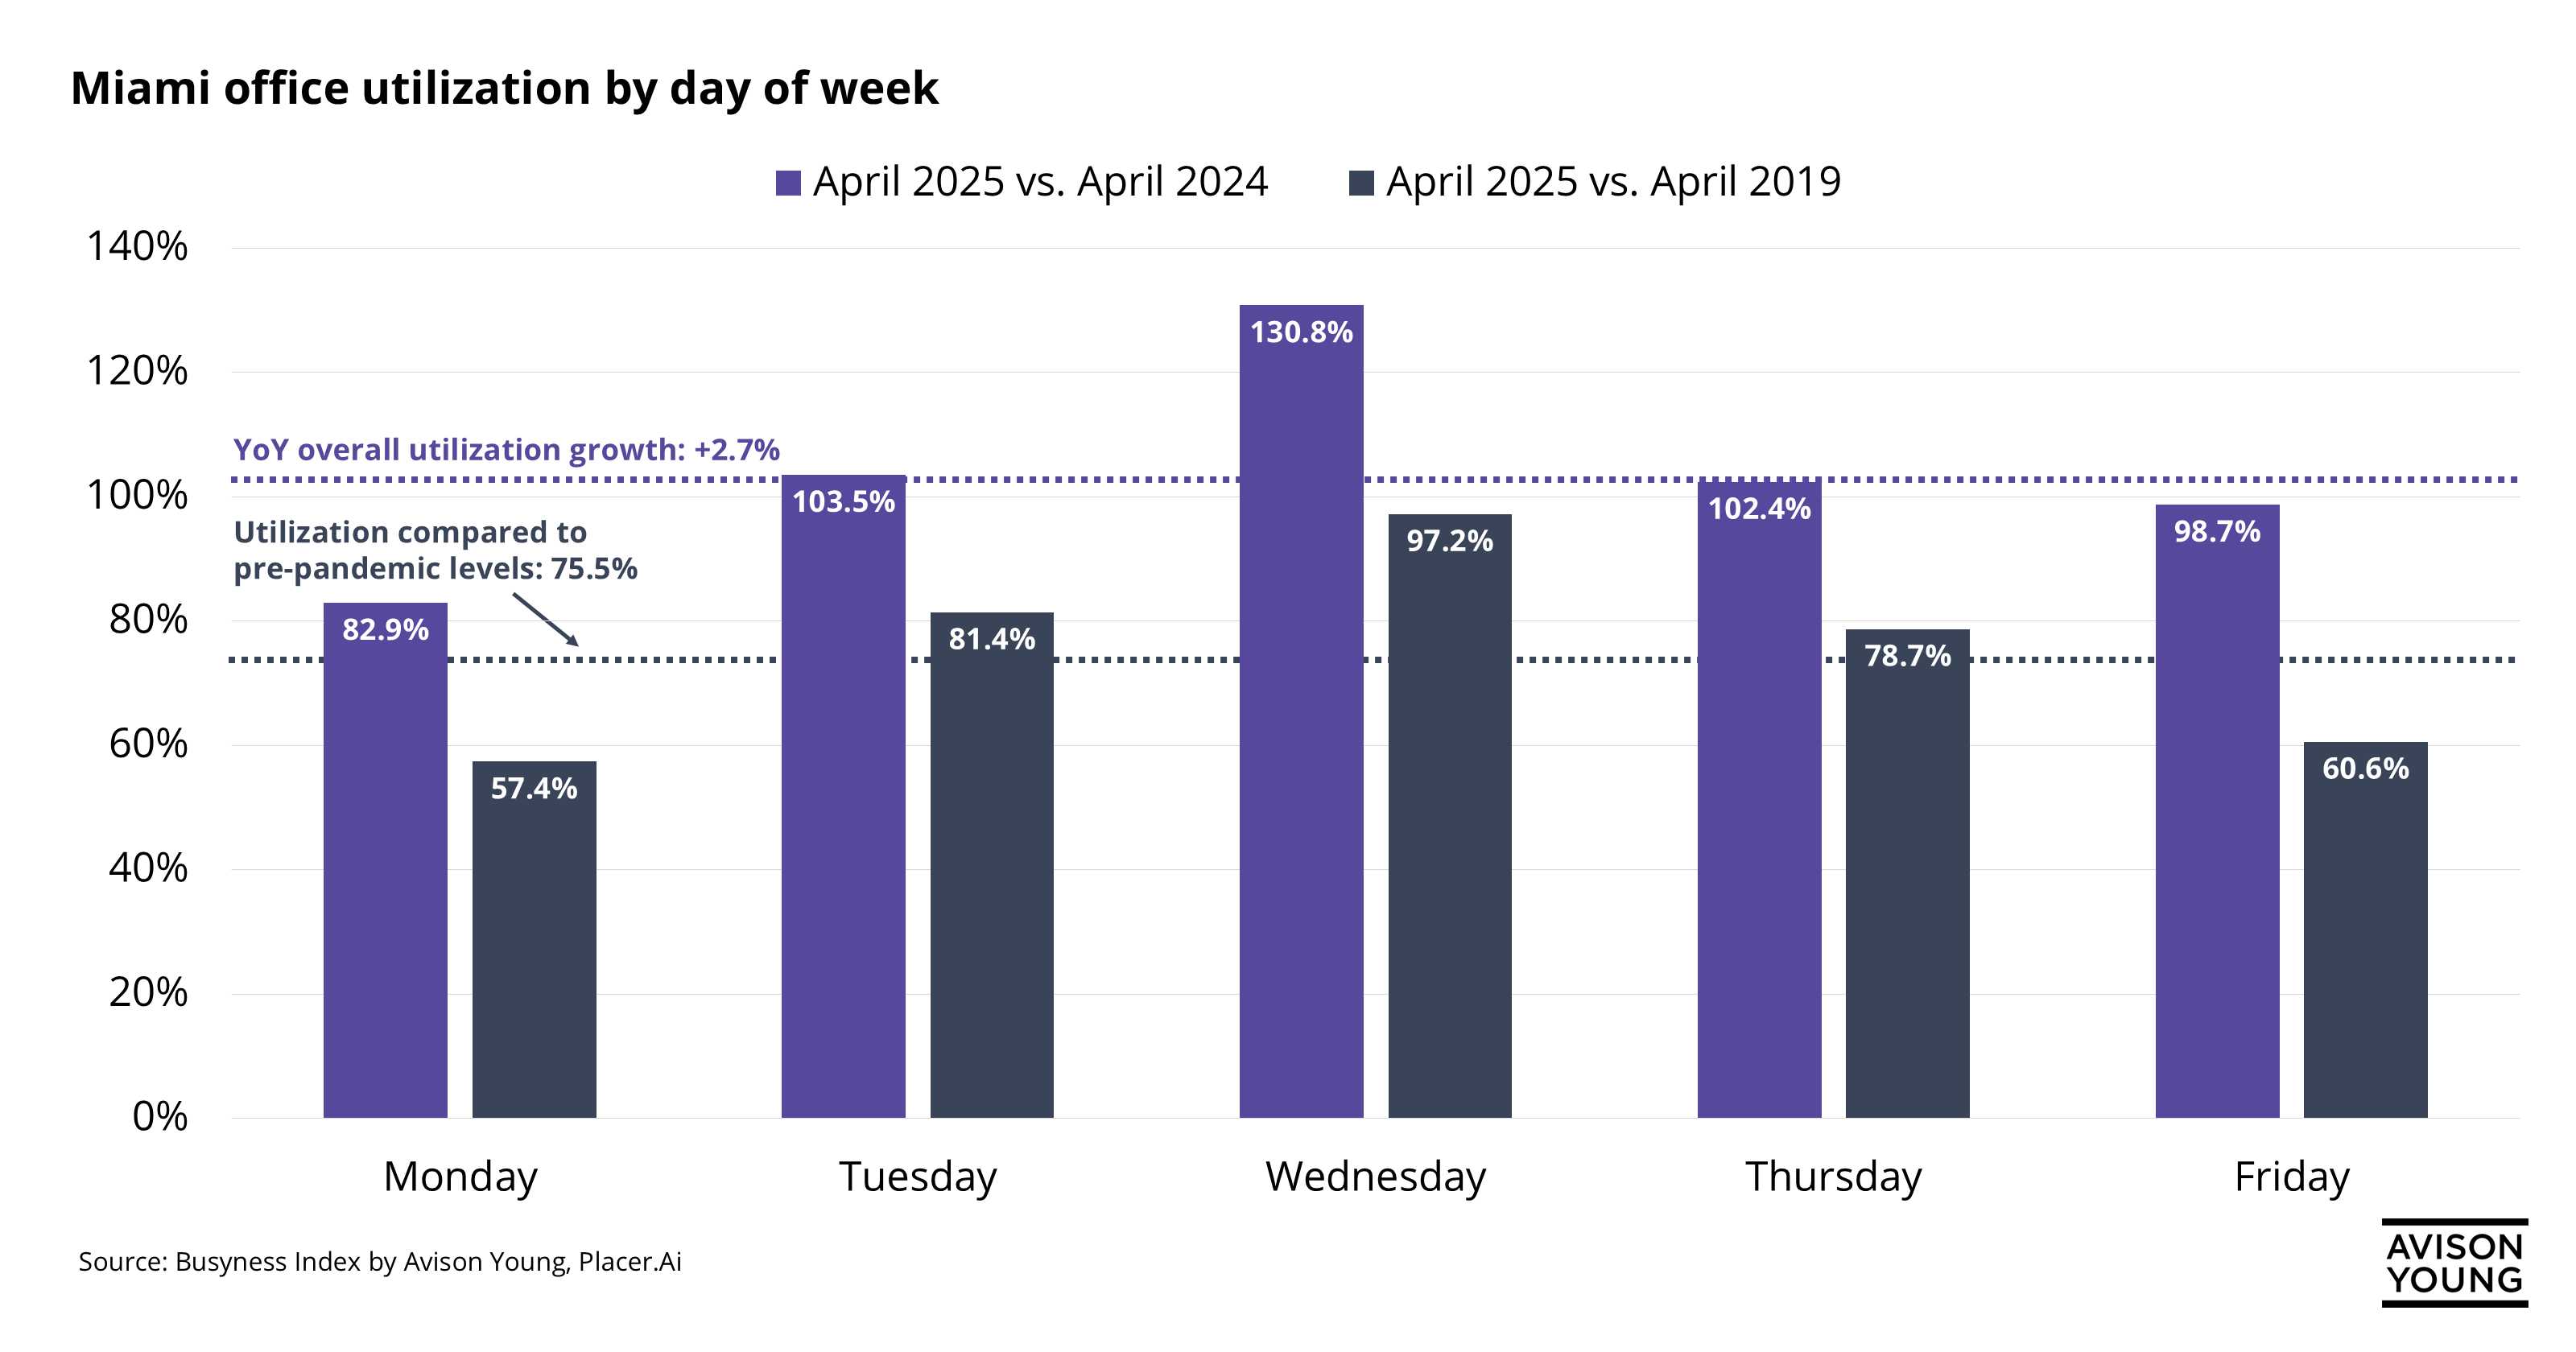 Miami sees strong mid-week office utilization growth
 -
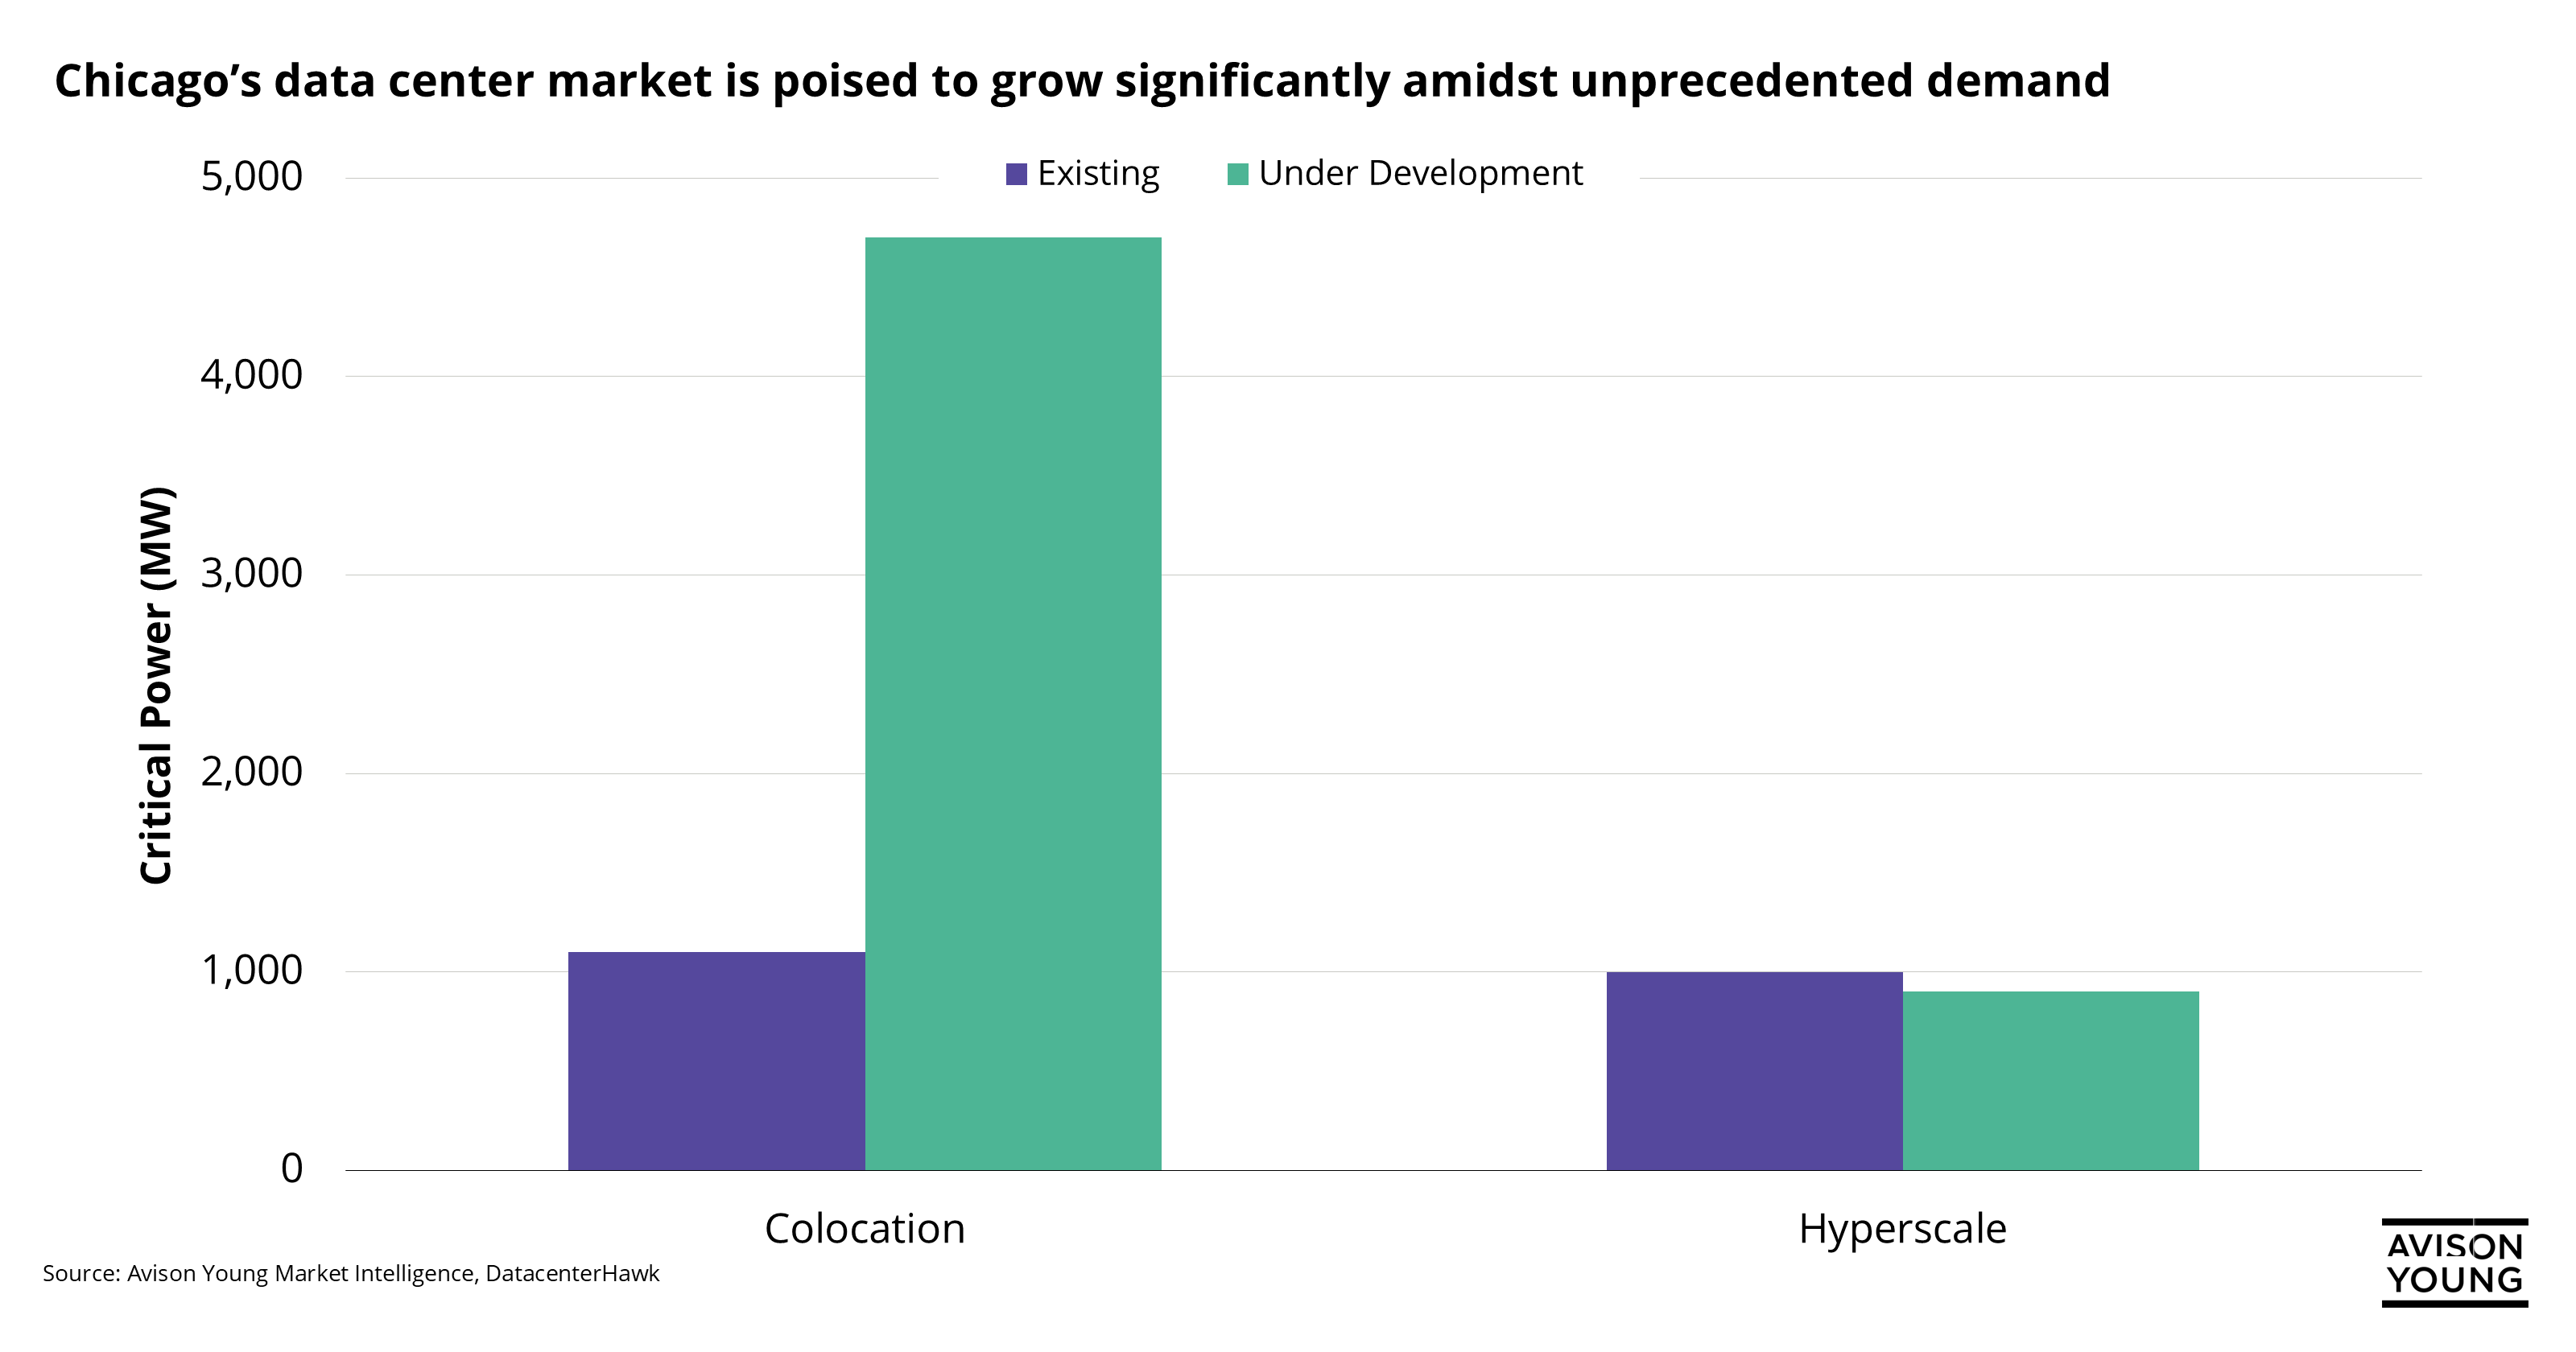 Windy city wired: Chicago’s data centers in bloom
 -
 Industrial buildings in Greenville-Spartanburg are getting smaller
 -
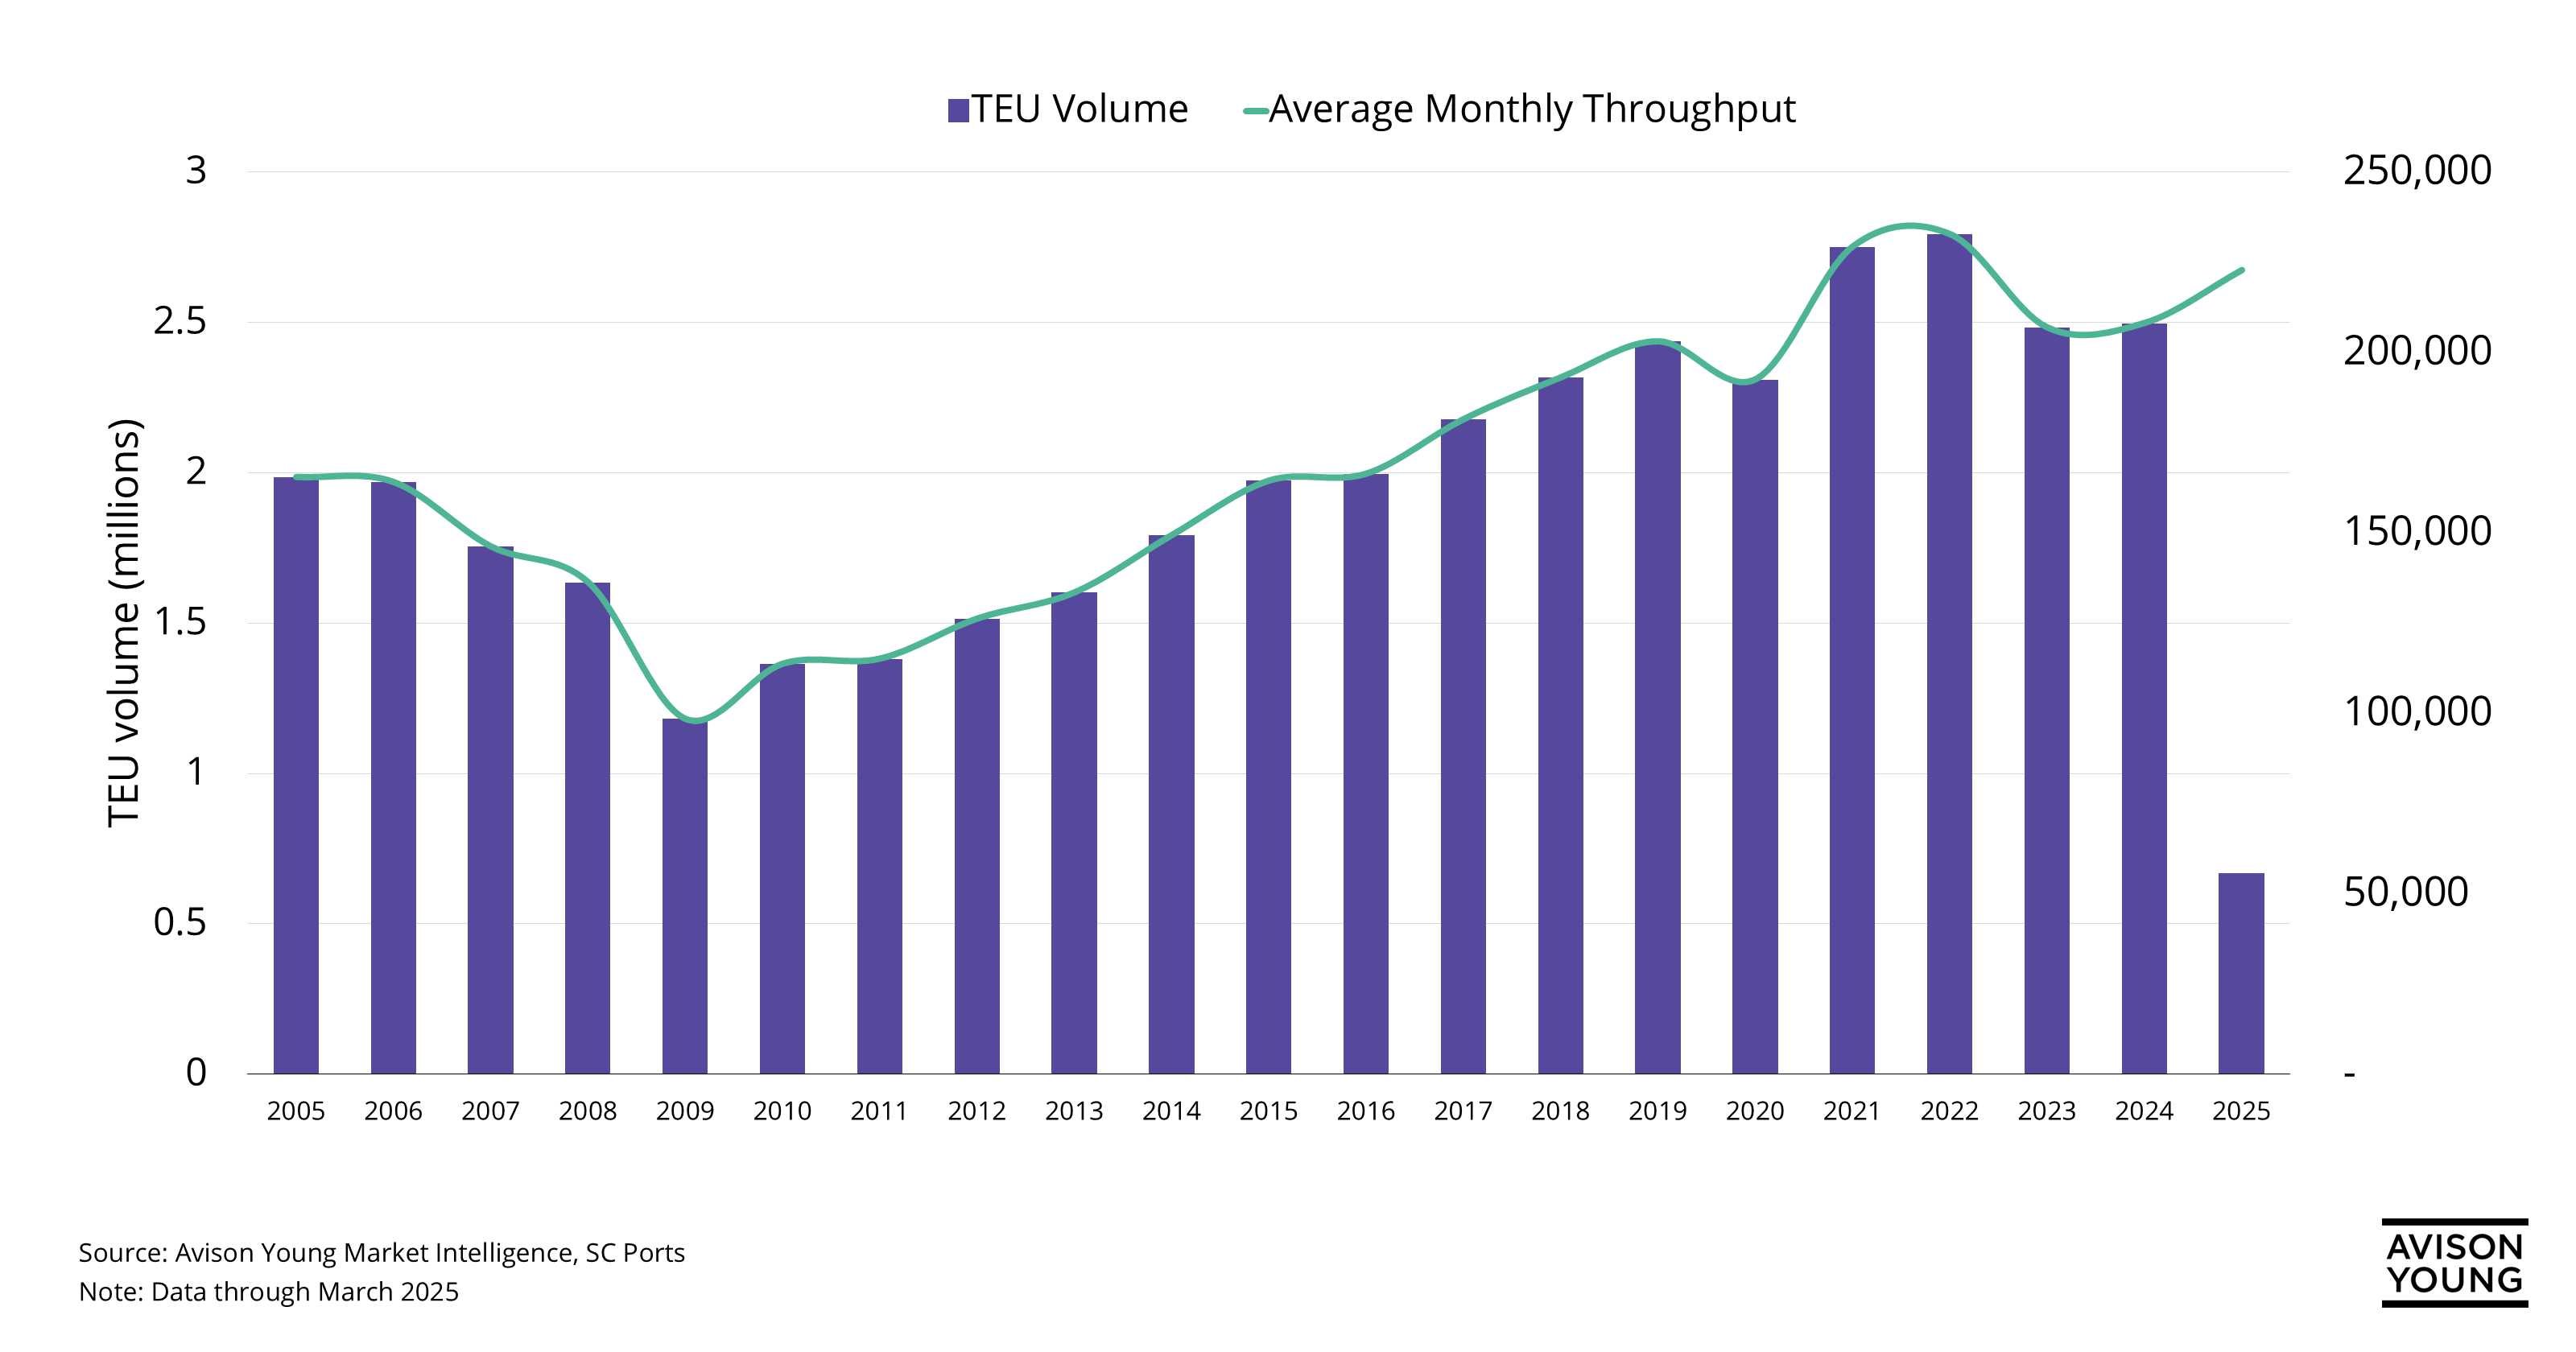 Charleston's port activity rises amid shifting trade dynamics
 -
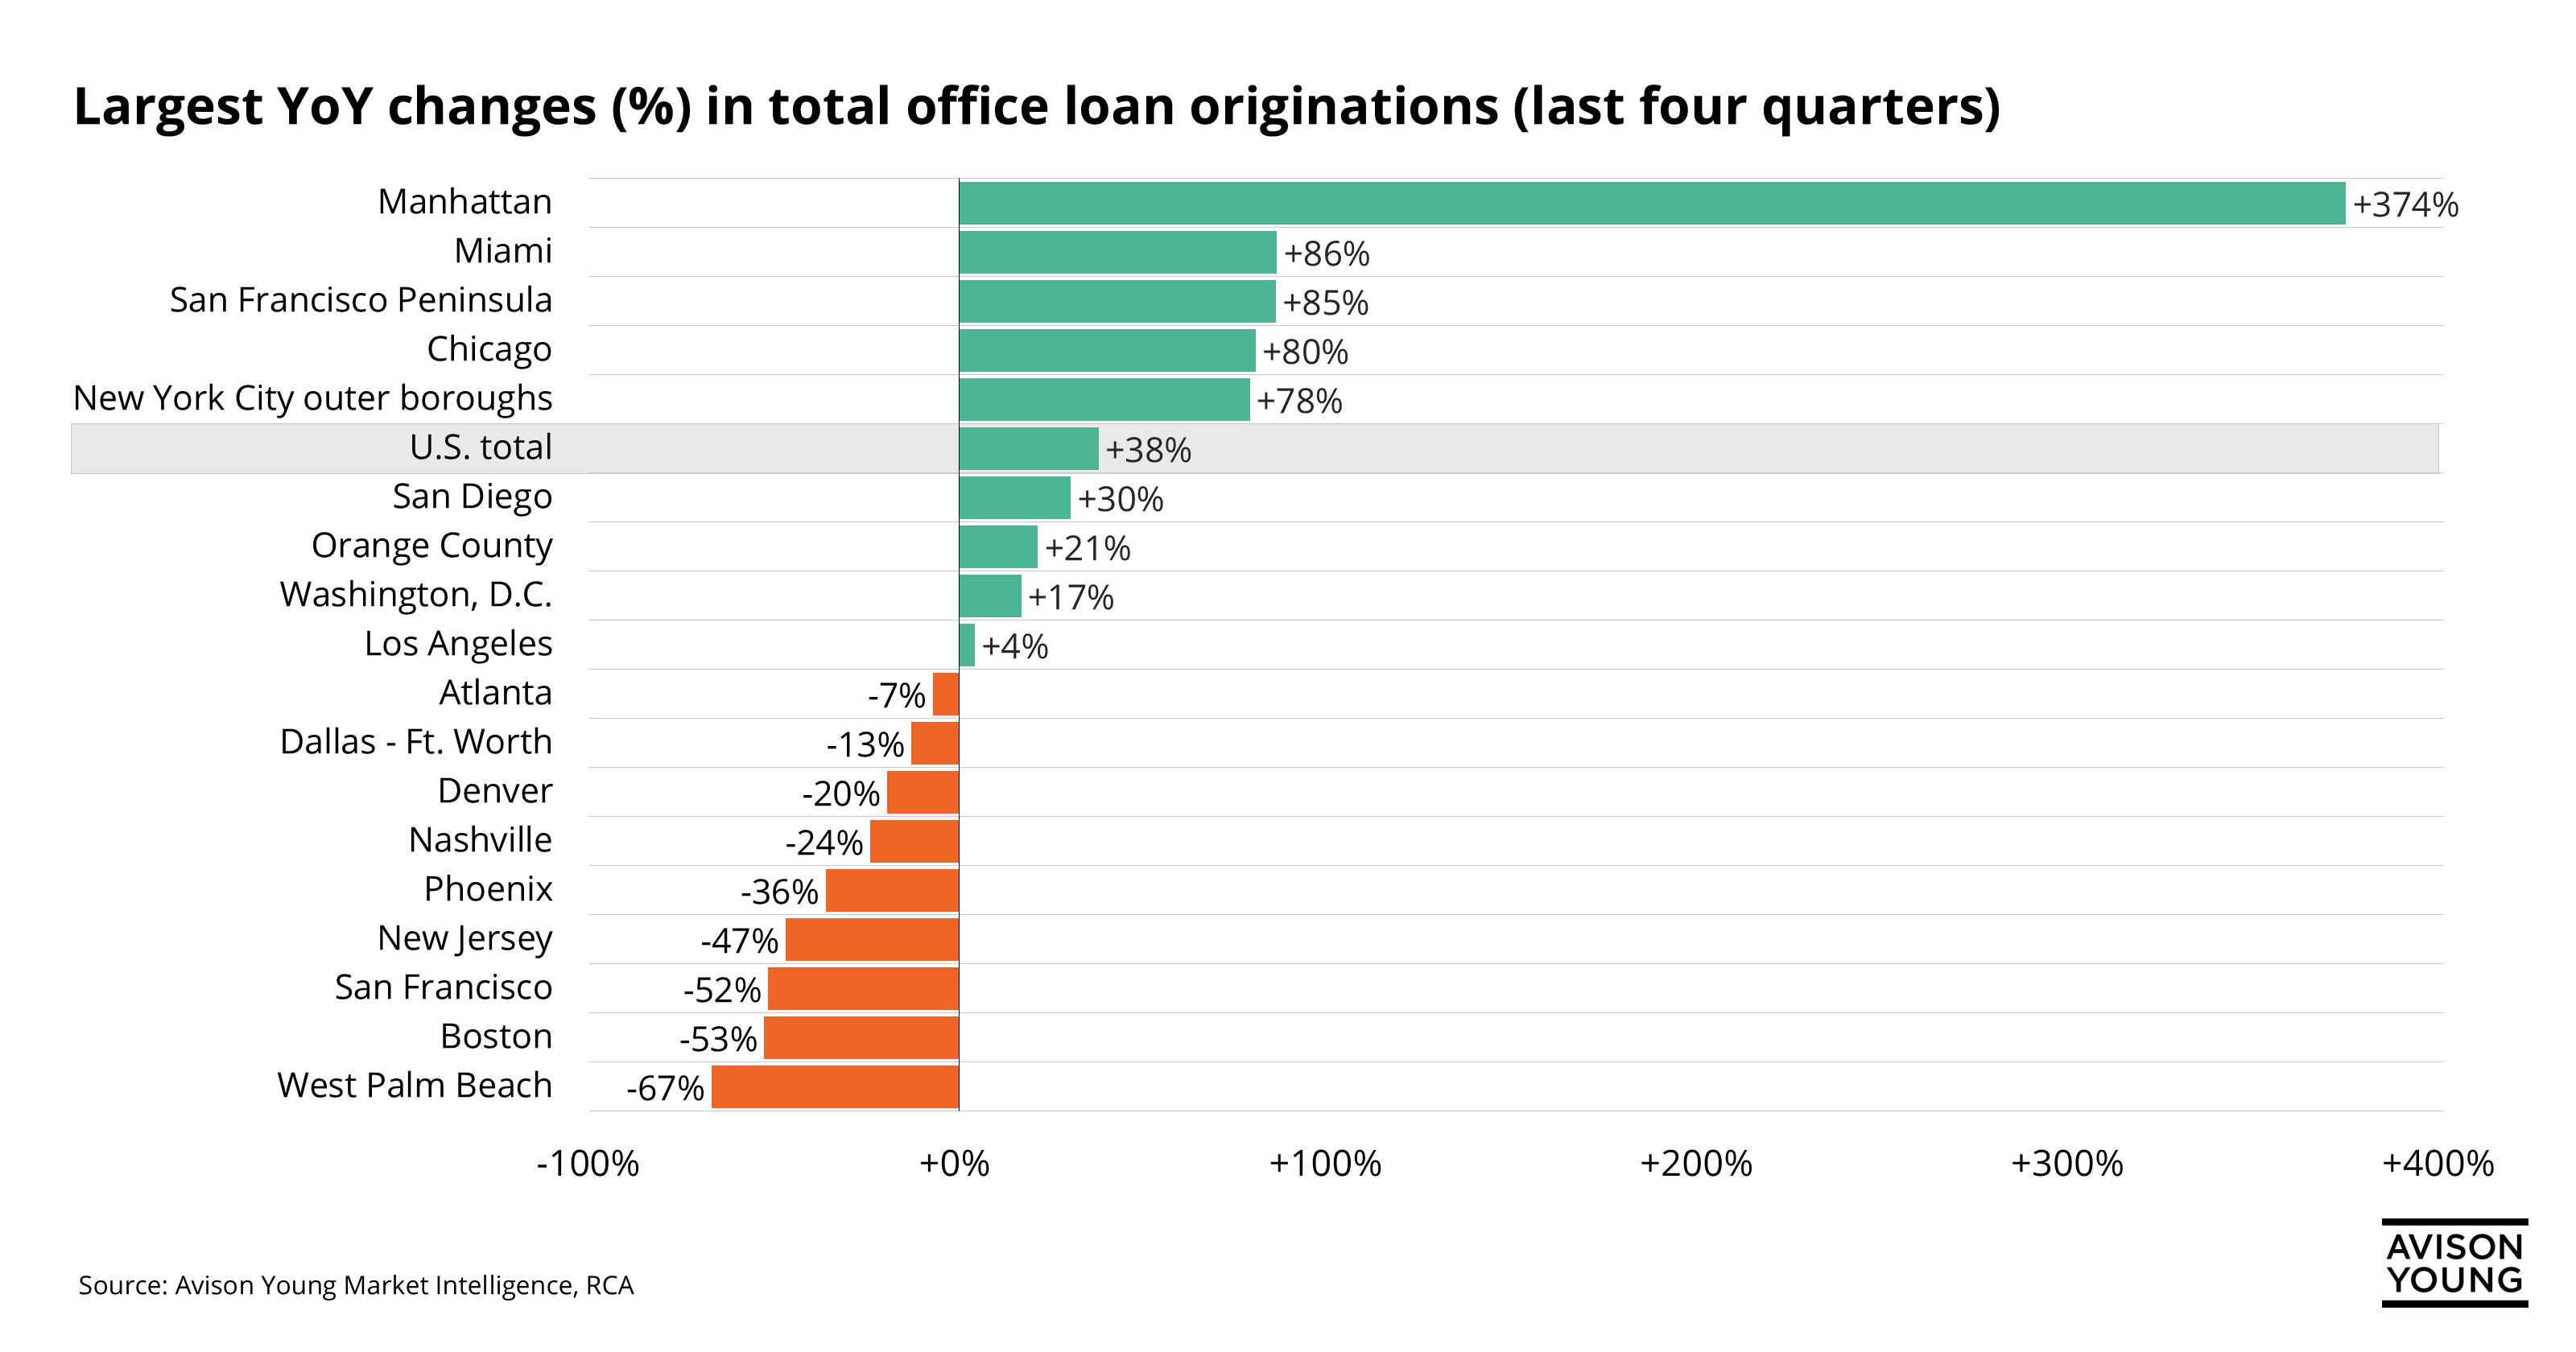 Selective confidence: U.S. office lending’s uneven rebound
 -
 Active smaller space users drive DFW’s first quarter office activity
 -
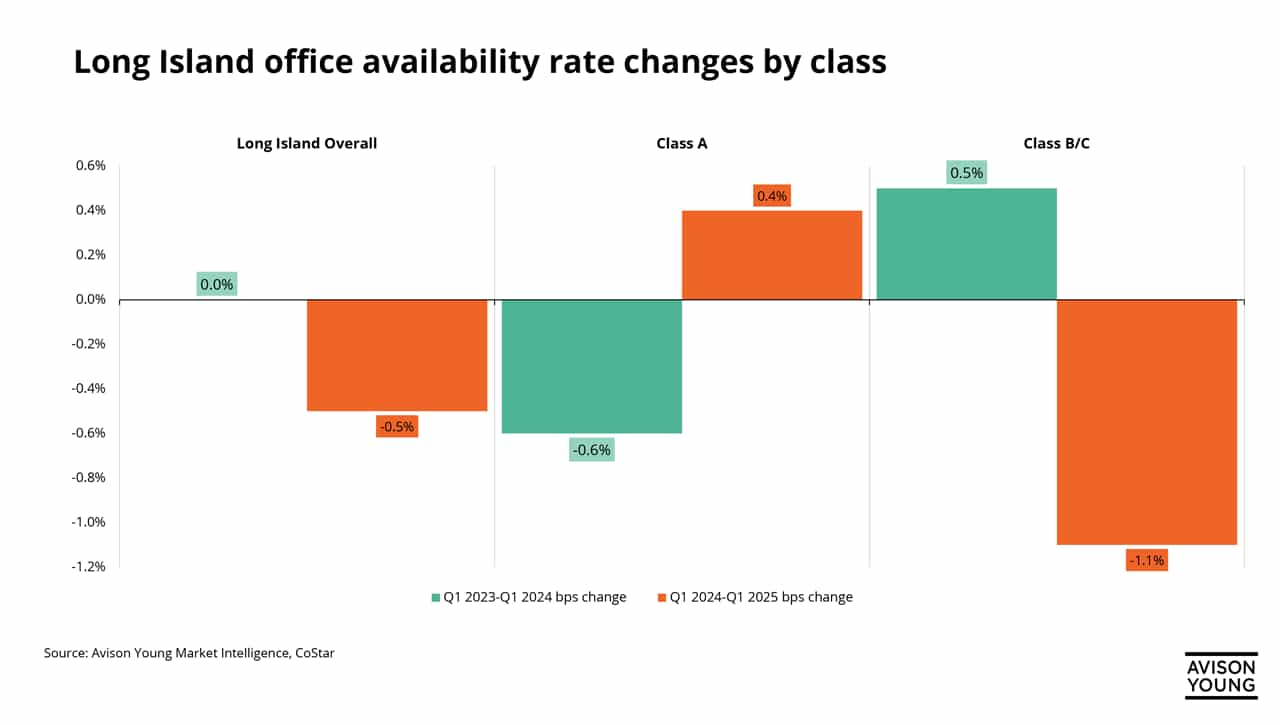 Class B/C office properties in Long Island lead the decline in availability rates
 -
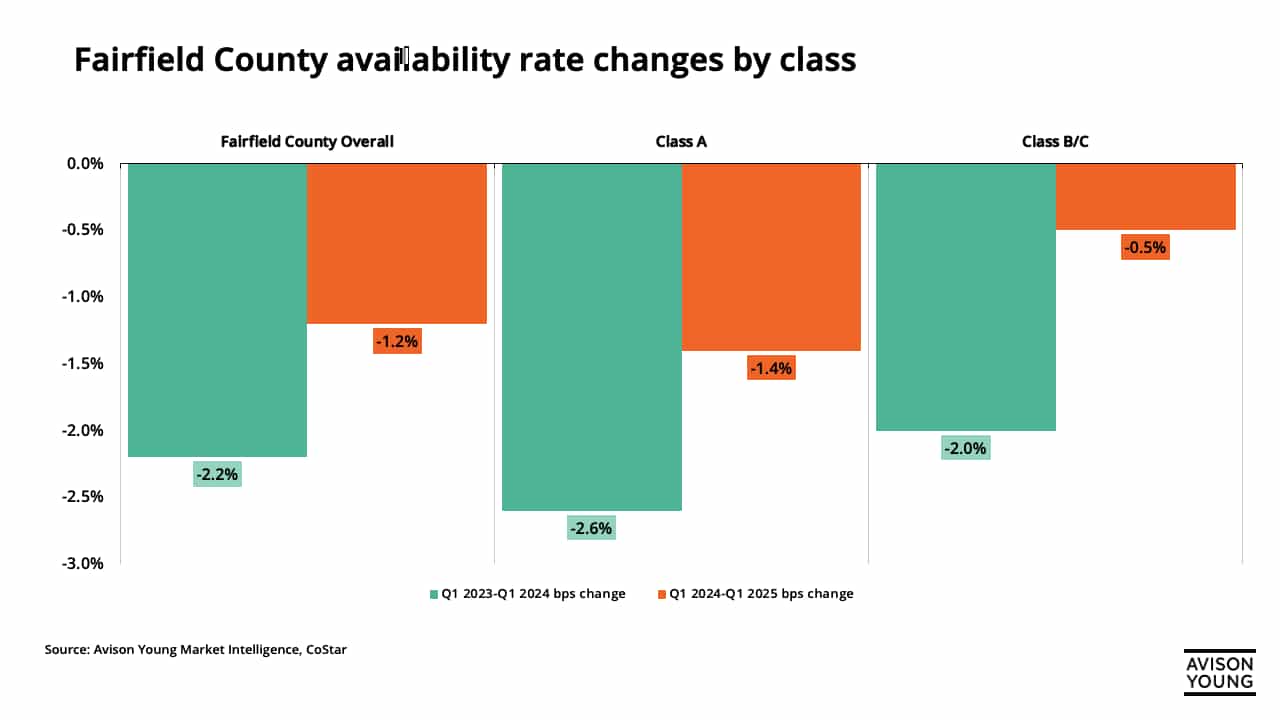 Fairfield County office properties see continued decreases in availability rate
 -
 Leasing demand remains strong for small-to-mid sized industrial properties in New Jersey
 -
.png/a4ae25fa-df6d-e748-9757-8a47e616b61b?t=1747063963869) Nashville industrial vacancy remains lowest among Southeastern peer cities despite high rents
Nashville industrial vacancy remains lowest among Southeastern peer cities despite high rents -
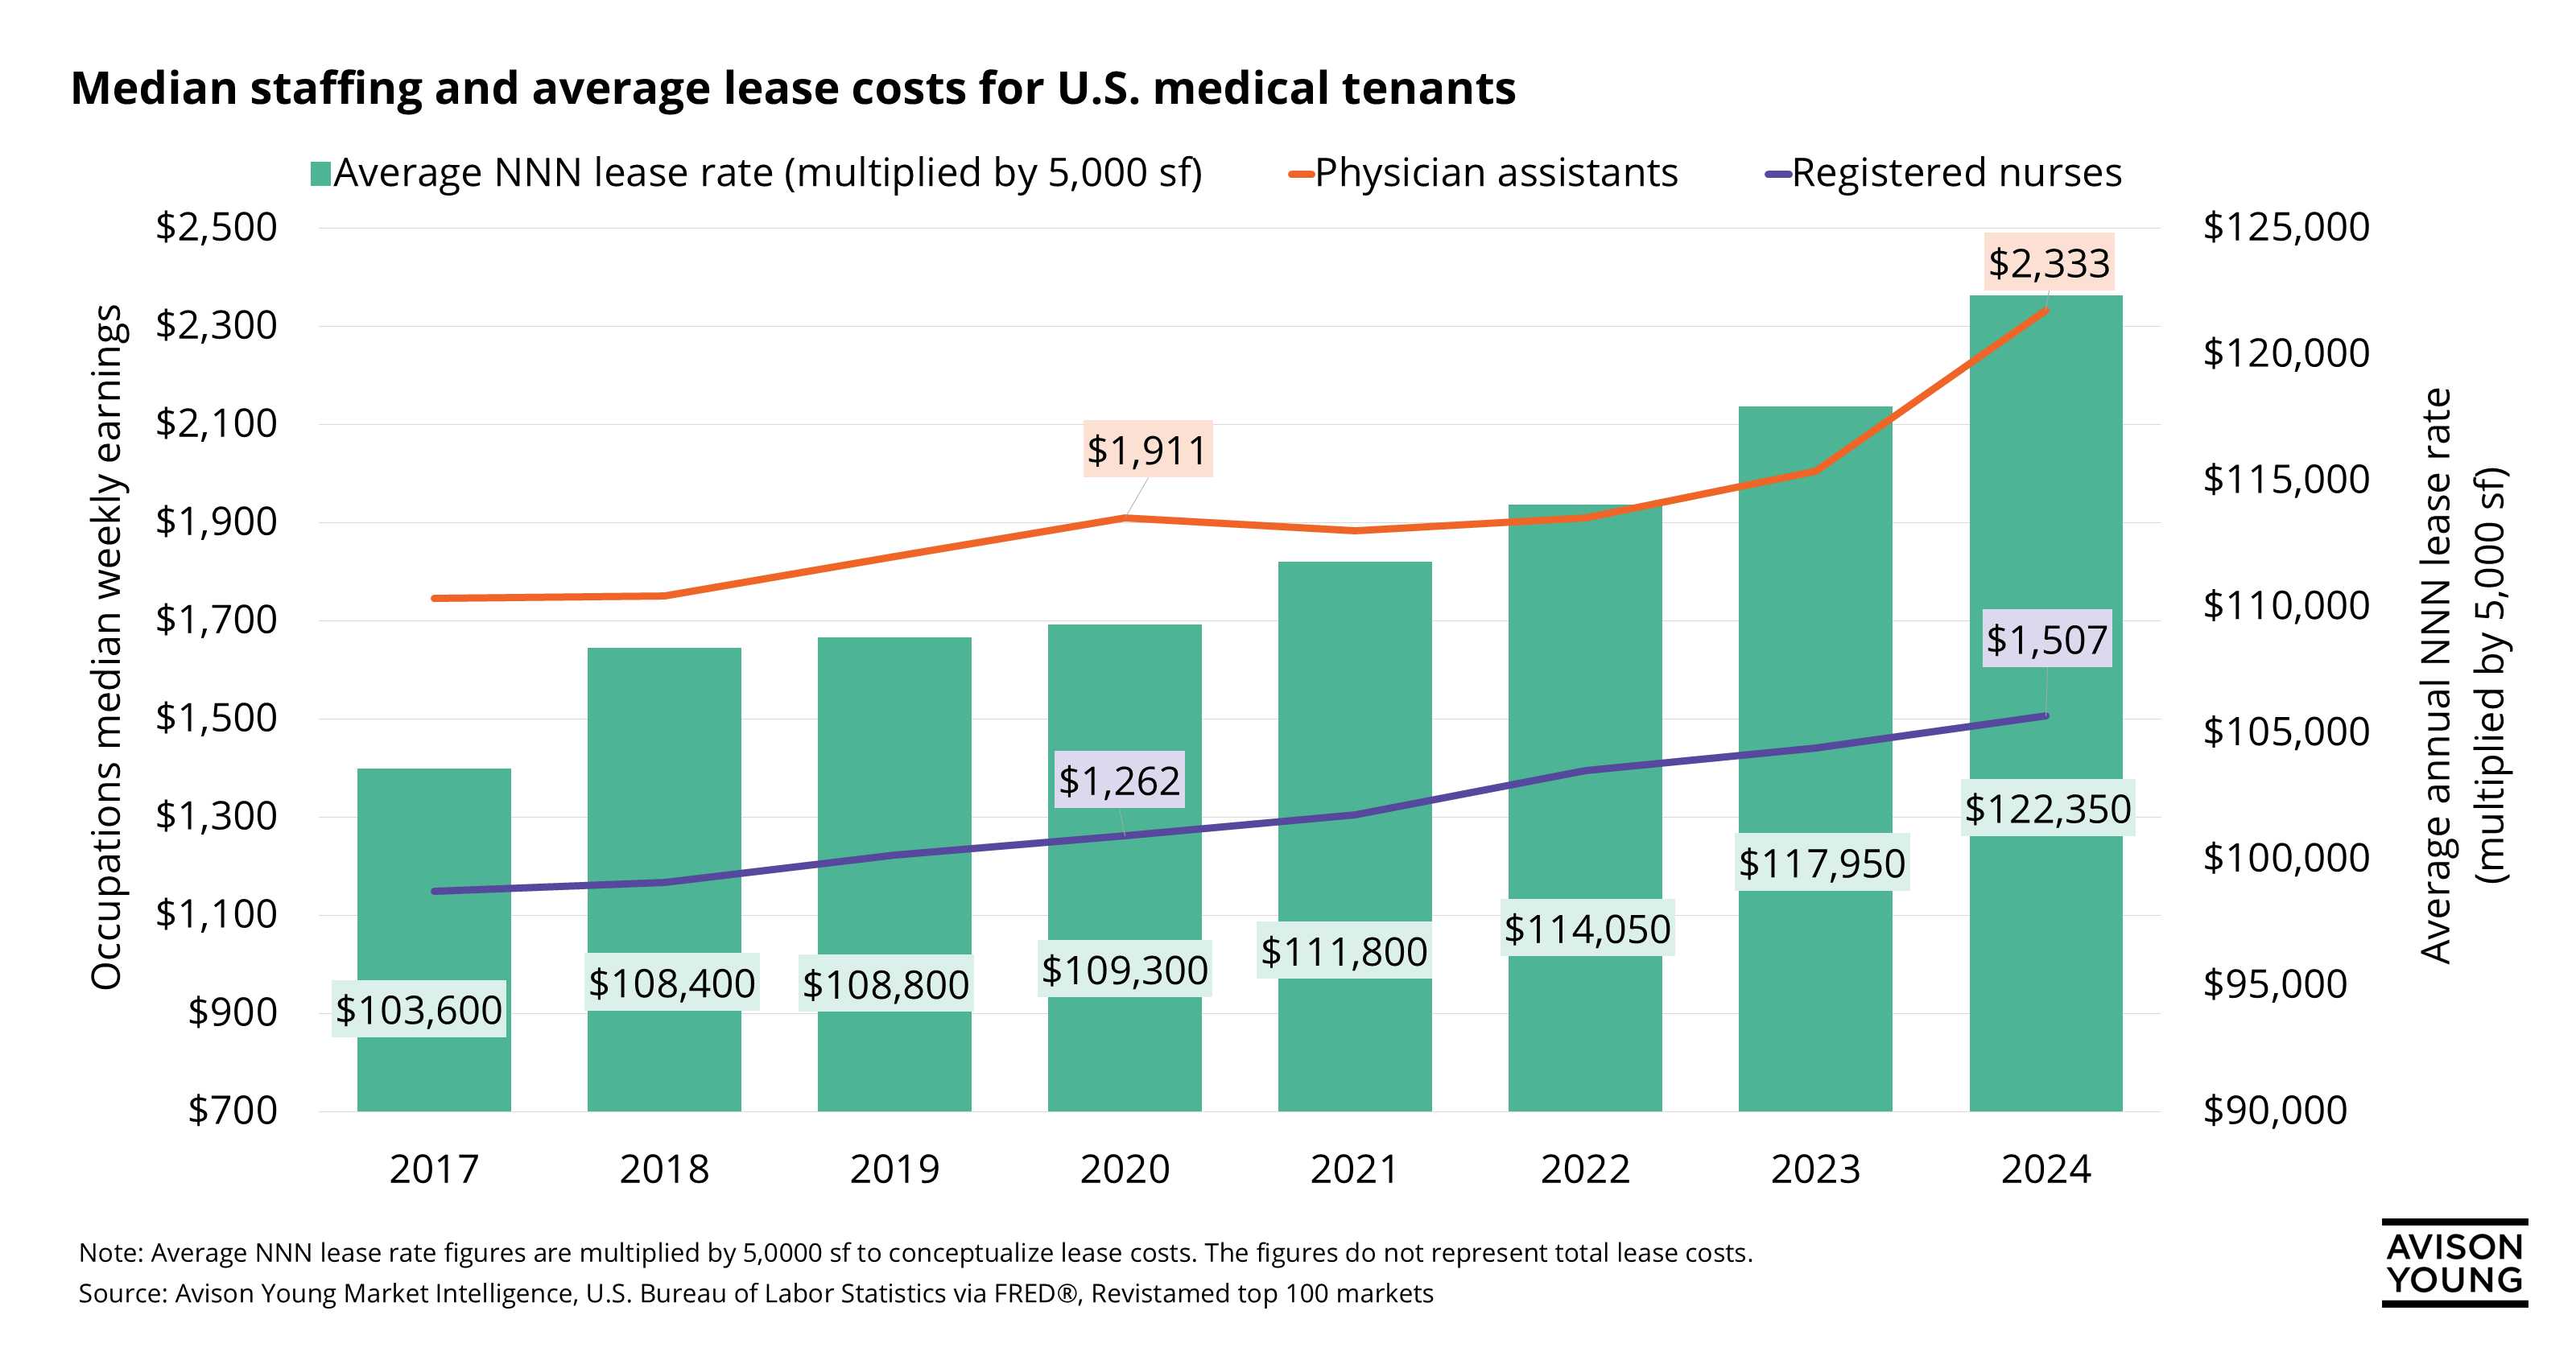 Rising rents and wages: The cost of a thriving U.S. medical occupier
 -
DFW’s industrial vacancy is much tighter than the averages suggest
-
 Construction timelines and development costs continue to hinder the viability of the Denver construction pipeline
 -
 Shifting tides: How class B and C office availability reflects U.S. market recovery
 -
 DFW’s office vacancy has improved, but it’s a mixed bag with newer assets


—
60 Items per Page