Fight or flight – Examining flight to quality in DC office buildings

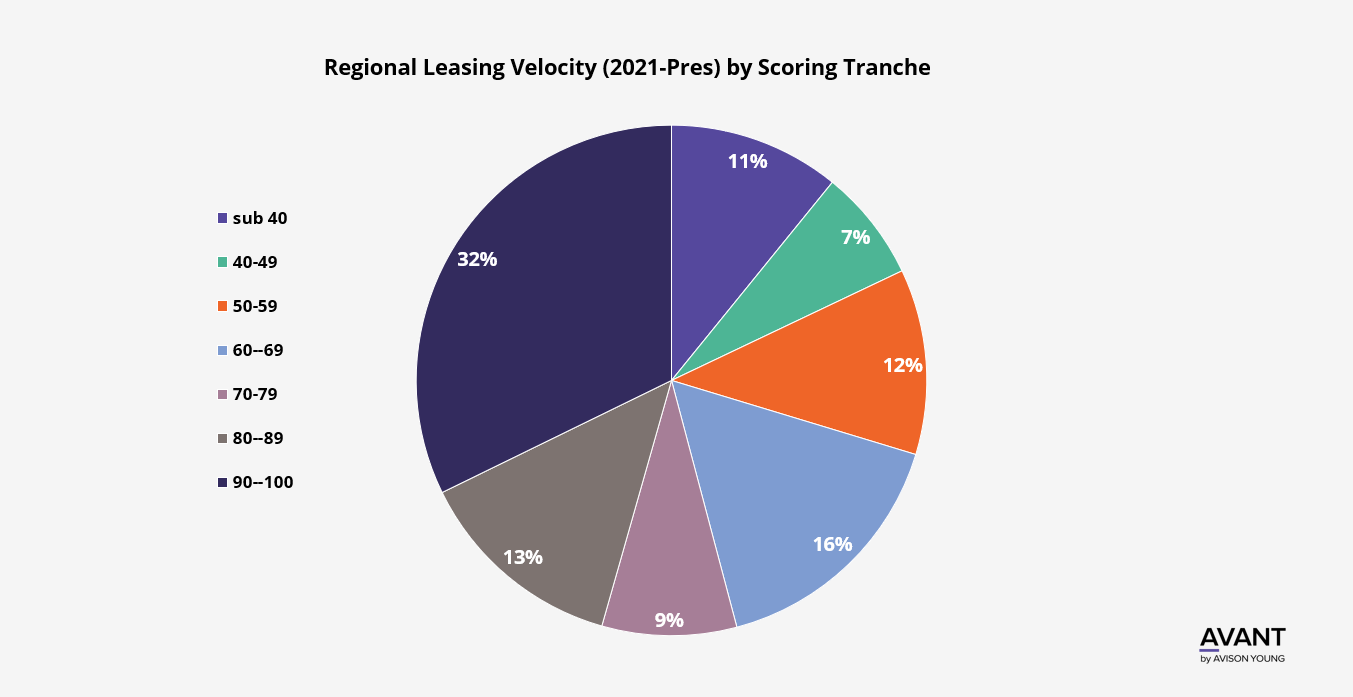
Since 2021 in the Washington, DC metro region, office leasing as generally been concentrated at the top of the market. Avison Young has developed a proprietary scoring model, that assigns buildings a score based on:
- Rent
- Year built
- Presence of a conference center
- Presence of a tenant lounge
- Presence of a roof terrace
- Presence of a private terrace
Based on the scoring output of the model, we can see that the top third of the market is responsible for roughly 53% of leasing since 2021. This includes all industries and transaction types (i.e. New leases and renewals). Note, outputs are uniformly distributed (ie if there are 10 properties, one is going to be 100%, one is 90%, one is 80% etc.)
Get market intel
US-DC-IAD Washington DC


